This post was written by Chris Kerlow of Richardson GMP.
“Is that a $20 dollar bill lying on the ground?” asks the student
“No it can’t be”, answers the professor. “If it were, someone would have picked it up by now.” – Caption from Howard Marks The Most Important Thing
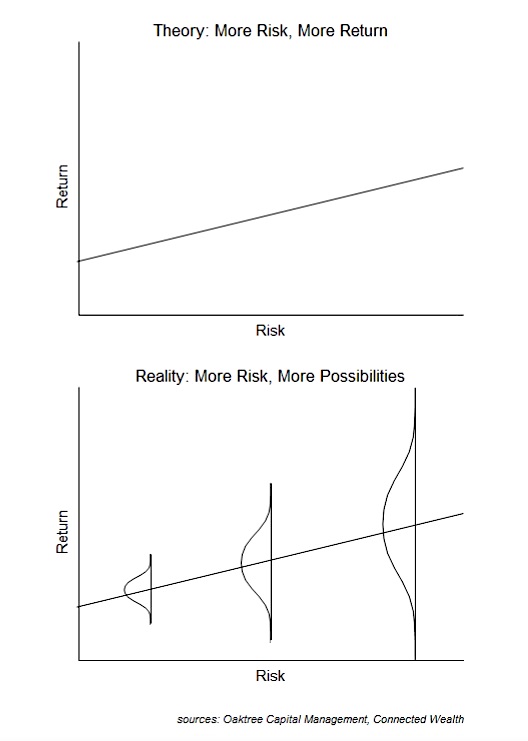
The efficient market hypothesis (EMH) was developed in Chicago during the 1960s and 1970s with the premise that it is impossible to beat the market as share prices incorporate all relevant information. In such an environment, the more risk one assumes, the greater the return. This is depicted in the top chart below, as risk rises, so does expected return. Yet in reality things are never so clean. The bottom chart below depicts an environment with many possible outcomes given various levels of risk. With so many scenarios, can the market really be efficient.
Today there is a large body of research that supports the Efficient Market Hypothesis and an increasing amount that refutes this claim. In this edition weekly market update, we will share some of the evidence and factors that appear to determine just how efficient different markets are.
Market Structure – The reality is there are frictions to investing that limits market efficiency. In an academic world, which does not exist in the real world, investors would act independently, willing to go long or short with little transactional friction. This is clearly not the case even in the more efficient large cap equity markets as there are many more long only investors compared to those willing to short a stock or the market. This structural bias limits Efficient Market Hypothesis (EMH). There is also transaction costs and informational availability. For large cap equities, information is widely disseminated and transaction costs are low. Yet in some markets, this is not the case. Real estate for instance has much higher transaction costs and information is not as easy to obtain. This limits EMH.
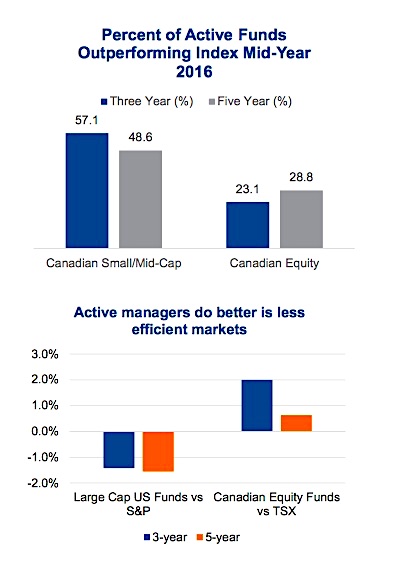
From a market structure perspective, less efficient markets tend to be more fertile ground for active manager. In the 1st chart on page 2 we contrast the percentage of managers in Canada outperforming their respective benchmarks for Small/Mid Cap and for the larger cap Canadian equity. This chart is based on the SPIVA mid-year 2016 update for Canada. Clearly, active portfolio managers do a better job in the small/mid cap (SMC) relative to large cap equities. SMC has fewer investors active in these names, less analyst coverage and likely higher borrowing costs for shorting relative to large cap, hence less efficient.
We also see market structure as a determining factor between Canada and the U.S. The U.S. equity market is one of the most efficient in the world given the number of investors, liquidity and diversification. As you can see in the 2nd chart, average performance of active fund managers has trailed the S&P 500 by over 1% annualized for the past three and five year periods. In Canada, with fewer investors and a market that is less diversified, active funds have tended to add value during this measurement period. This is based on the 2015 year-end SPIVA report, and we look forward to updating once the 2016 report is released.
The degree of market efficiency clearly has a relationship with the market structure. Markets with fewer participants, higher transaction costs, less ease of information gathering tend to be less efficient markets. Giving active management an edge in less efficient markets and passive investing an edge in more efficient markets.
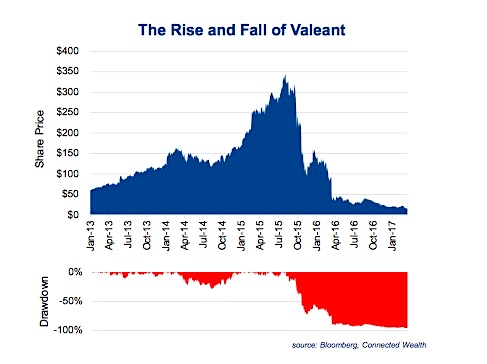
Investor Behavior – Investors also do not act independently, and often behave more like a herd or suffer from behavioral biases. All investors are most prone to cognitive mistakes, which is an area of growing academic and real life research. Overconfidence and anchoring themselves in their opinions not allowing them to adapt to new information are commonplace. Not to pick on Valeant, but many investors were immensely confident in the company as it marched from $150 to $350 in 2015. This overconfidence then became the downfall of many as it marched down to $15 today. If you believe in the efficient market, it is difficult to argue it was efficient at $300 and is also efficient at $15. Investors often suffer from the disposition effect where they hold on to stocks that are losers not wanting to accept a loss and sell winners too soon to lock in a small profit.
Investment Implications
For portfolio managers it is becoming imperative to incorporate checks and balances into our process to watch for these behavioral biases. It is also prudent to understand how efficient a given market is. Our approach with Managed Portfolios is to be more active in less efficient markets and lean more towards cheaper passive investment strategies in more efficient markets. An example, we are more active in the Canadian equity market and more passive in the U.S. equity market.
Thanks for reading.
Charts are sourced to Bloomberg unless otherwise noted.
Twitter: @ConnectedWealth
Any opinions expressed herein are solely those of the authors, and do not in any way represent the views or opinions of any other person or entity.

 and Russell 2000 (IWM)")


 and Russell 2000 (IWM)")
