Key Stock Market Takeaways:
– Adapting to uncertainty provides fuel for growth
– Earnings backdrop weighs on encouraging valuations
– Rather than calling turns, wait for trends to improve
We wrote last week about staying patient in the face of weakness and earlier this week about bracing ourselves for negative headlines.
Both of those remain true as economic weakness is fueling financial market volatility. In the face of this uncertainty, our patience will be tried and our resilience will be tested. Market and economic opportunities will emerge as we learn, adapt and grow in what will truly be a “new normal.”
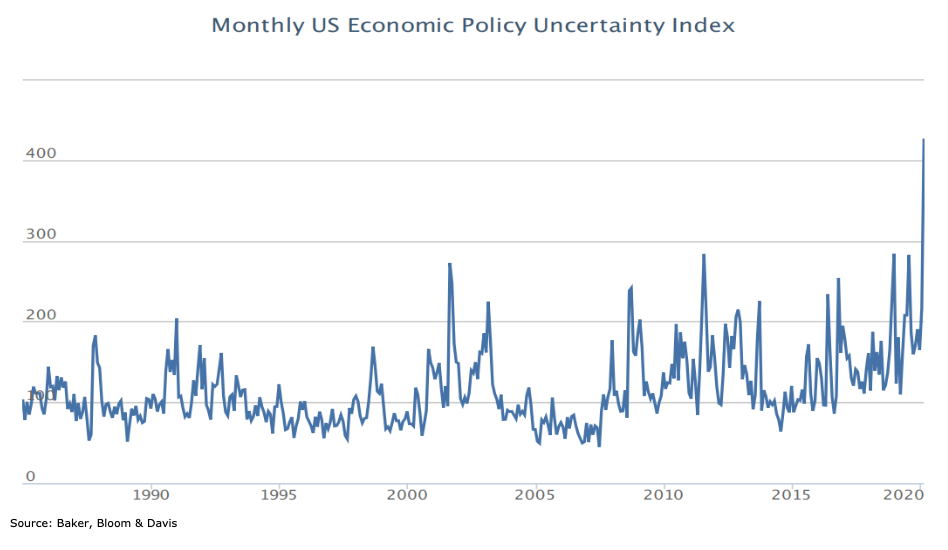
There are many eye-popping charts and photos that are being shared right now (those showing the trajectory of initial jobless claims or empty streets during rush hour come to mind). Perhaps one of the least surprising is the monthly update of the economic policy uncertainty index.
This shows uncertainty soaring over the past month and reaching a level well beyond anything observed in its 30+ year history). We don’t really need a chart to tell us that; we are experiencing it in our daily lives. Some charts argue for action but in this case it just provides context and confirmation.
Uncertainty is changing our behavior. We are spending less and driving less. We are working from home more and being virtually connected (with family and co-workers) more. We’ve put down old habits and picked up new ones. The disruption that comes with the shedding of routines has been a challenge. It is also an opportunity. That which was not useful can be dropped, that which is useful can be picked up.
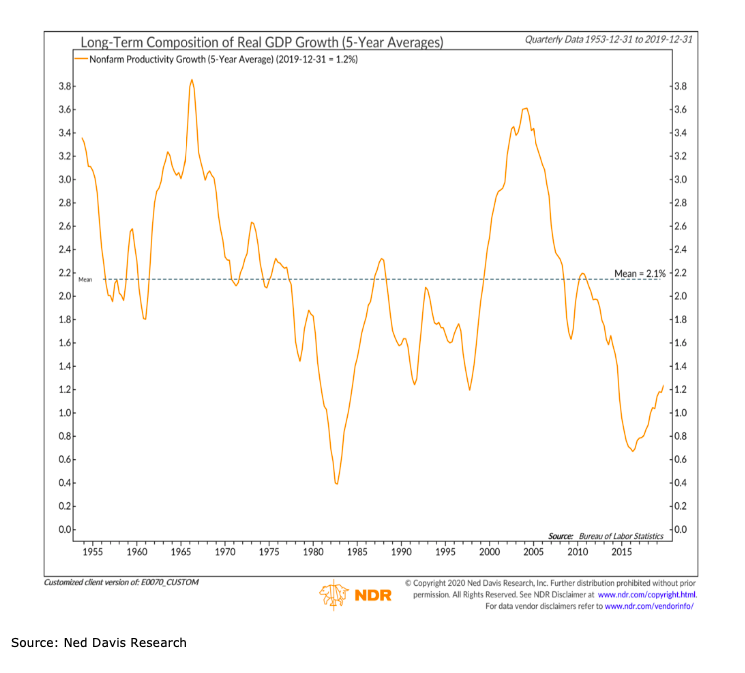
Productivity growth has been slowly climbing in recent years. Expect this to accelerate as American ingenuity figures out how to do more with less and we adapt to the circumstance in which we find ourselves. Technological conveniences will become engines for growth in the economy that emerges.
Uncertainty has also changed what investors are willing to pay for stocks. The S&P 500 fell in each of the first three months of 2020, losing 20% of its value over the course of the quarter. As a result, valuations have improved dramatically. The P/E ratio for the S&P 500 has dropped out of overvalued territory and is now at its lowest level in seven years. This is encouraging and could end up being an opportunity for patient investors. We would not lean into this too heavily at this point.
Economic weakness is likely to have a significant impact on earnings. Earnings estimates are being rapidly revised lower and while trailing earnings are more reliable than forecasted earnings, earnings results for the past year may have little bearing on the outlook for the next 12 months (and beyond).
While looking for better productivity growth trends and seeing improving valuations, a patient approach in the near term means waiting for evidence that trends are improving.
Discussions of up days and down days in the stock market can get so bogged down that an essential reality becomes obscured – risks and volatility are elevated in downtrends and subside in uptrends.
Rather than try to time the market, a better approach is to listen to the evidence and follow the trend. It’s a good time to set aside the desire to anticipate the bottom, or try to call one in real-time. Instead, watch the trends and be prepared to follow them when they become more clearly positive.
Last week’s three-day rally (best since 1931 by some measures) generated headlines, but failed to produce the follow-through that would be expected if an up-trend were emerging. Sector leadership remained defensive and size leadership stayed with large-caps (neither of which is expected in the early stages of a new up-trend). This week brought poor rally participation and renewed selling pressure.
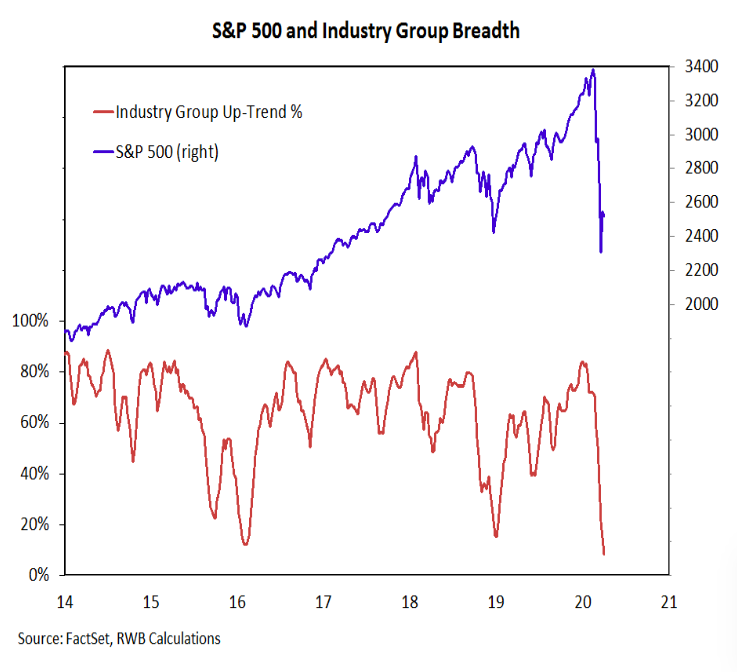
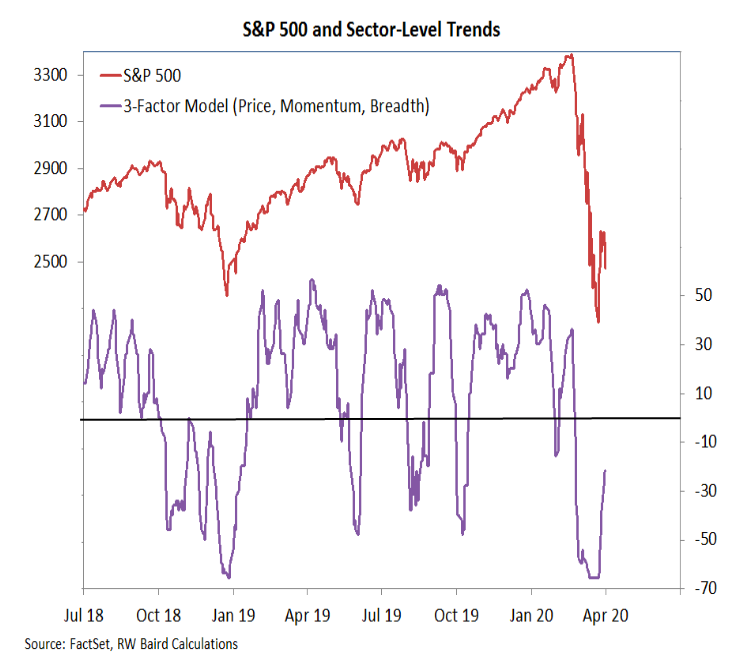
Trends at the industry group (shown above) and sector-level (shown to the left) offer little evidence that a meaningful turn higher has taken place. The percentage of industry groups in up-trends continues to fall and despite the S&P 500’s bounce off its lows, the sector-level model remains in negative territory. Rally sustainability has been suspect when this has been the case in the past.
Twitter: @WillieDelwiche
Any opinions expressed herein are solely those of the author, and do not in any way represent the views or opinions of any other person or entity.


: Showing Some Signs of Emerging Strength")
