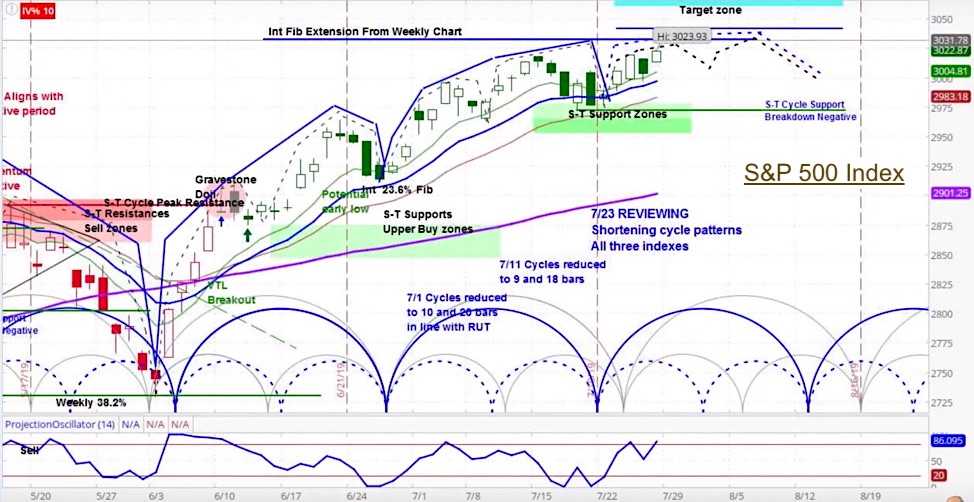
S&P 500 Index (INDEXSP: .INX) Daily Chart
The stock market gained ground again last week, reaching all time highs, as I pointed out in the latest Market Week show.
The S&P 500 (SPX) rose 49 points to 3026, an increase of 1.6%.
Yet based on near term market cycles, our projection is for weakness into the end of this week.
Our approach to technical analysis uses market cycles to project price action.
While we believe that momentum will continue to carry the S&P 500 higher, our analysis is for a small down week, within the context of its current minor cycle, as shown on the chart above.
Market Week Video – for week of July 29
Last week’s move was driven by earnings performance that exceeded analyst expectations. On Friday, for example, companies such as Google, Starbucks, Intel, and Twitter all rose on better then expected earnings.
In fact, the majority of companies have exceeded the average estimates for last quarter. Yet as we previously pointed out, that is based on lowered earnings guidance. This may continue, as for the current quarter, managers have continued to provide negative guidance by a ratio of 3 to 1.
For more from Slim, or to learn about cycle analysis, check out the askSlim Market Week show every Friday on our YouTube channel.
Twitter: @askslim
Any opinions expressed herein are solely those of the author, and do not in any way represent the views or opinions of any other person or entity.


 and Semiconductors (SMH): Concerning Price Pattern?")
 and Semiconductors (SMH): Concerning Price Pattern?")


