Dow Jones Transportation Average “Monthly”
This stock market index is an important cog in the broader market wheel.
The transports represent a big chunk of the economy and therefore are an important industry to watch for investors.
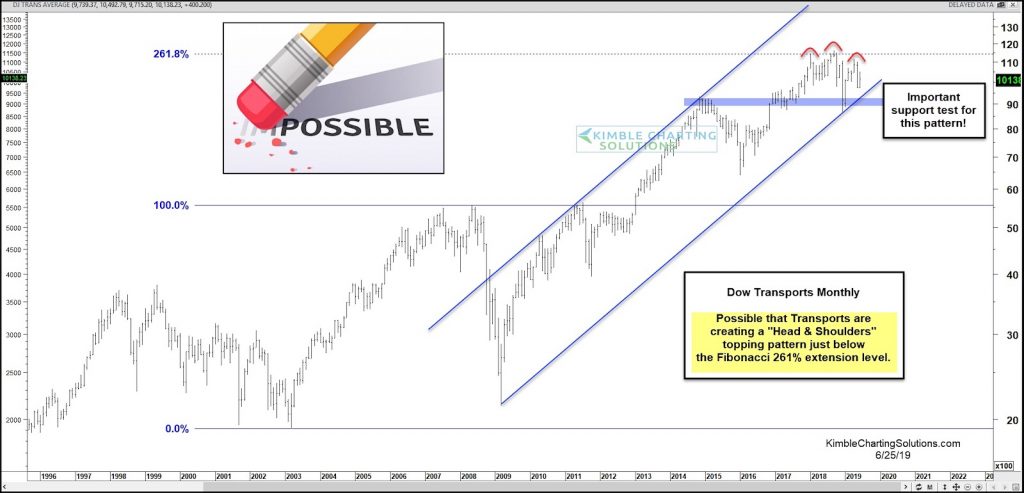
Today’s chart looks at the Dow Jones Transportation Average over the past 20 years. As you can see, the transports have been in a broad rising channel since bottoming in 2009.
But the index has taken a long pause at its 261% Fibonacci extension level.
That pause has taken the shape of a potential “Head & Shoulders” topping pattern. The blue-shaded lateral support line represents the line in the sand for this pattern. A move below that level would be troublesome for investors. Stay tuned!
Note that KimbleCharting is offering a 2 week Free trial to See It Market readers. Just send me an email to services@kimblechartingsolutions.com for details to get set up.
Twitter: @KimbleCharting
Any opinions expressed herein are solely those of the author, and do not in any way represent the views or opinions of any other person or entity.


: Showing Some Signs of Emerging Strength")
