The transportation sector is an important part of the US economy. Planes, trains, and automobiles… or something like that.
But the past couple years have seen the Dow Jones Transportation Average lag the major stock market indices.
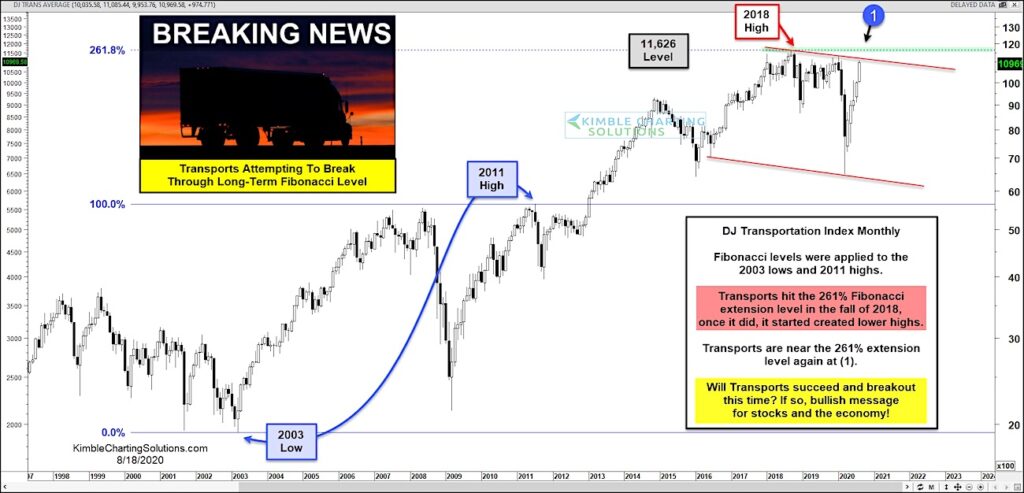
In fact, as you can see in today’s chart, the Dow Jones Transportation Average peaked in 2018 at an important price level – the 261.8 Fibonacci extension (using the 2003 low and 2011 high).
Since then, the Transports have created lower highs.
But that is being tested this month, as the lagging transports attempt to breakout.
A breakout over the prior high would break the trend of lower highs. And follow through over the 2018 high would be bullish longer term.
Will transports succeed and breakout here? If so, it would send a bullish message to stocks… as well as the economy! Stay tuned!
Dow Jones Transportation Average Chart
Note that KimbleCharting is offering a 2 week Free trial to See It Market readers. Just send me an email to services@kimblechartingsolutions.com for details to get set up.
Twitter: @KimbleCharting
Any opinions expressed herein are solely those of the author, and do not in any way represent the views or opinions of any other person or entity.


