The stock market has been grinding in place a bit to start the new year (2026).
And one index that bears watching for international capital flows is the Dow Jones Industrial Average. It seems the S&P 500 and Nasdaq capture a good deal of domestic flows, while the Dow Industrials are a barometer of international flows.
With this in mind, we take a look at the price chart of the Dow Industrials. While it is still showing price moving lower left to upper right (bullish) and the trend still intact (bullish), there are a few things to look at.
Today, we highlight the importance of the 50-day moving average (ma), a key price trend indicator.
Note that the following MarketSurge charts are built with Investors Business Daily’s product suite.
I am an Investors Business Daily (IBD) partner and promote the use of their products. The entire platform offers a good mix of tools, education, and technical and fundamental data.
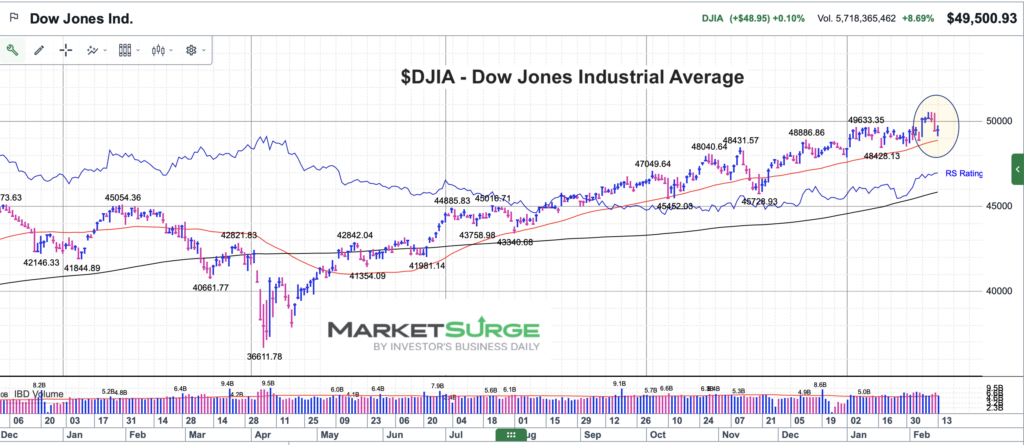
$DJIA Dow Jones Industrial Average Chart
Here we can see that the 50-day MA has only been broken to the downside once (in November) since last May. It has otherwise absorbed a few tests and remained above the 50-day MA. This is important because price is flirting with this area again. The only thing that makes me cautious on the Industrials is if this price support indicator breaks down. Stay tuned!
Twitter: @andrewnyquist
The author may have a position in mentioned securities at the time of publication. Any opinions expressed herein are solely those of the author, and do not in any way represent the views or opinions of any other person or entity.


