Last month we showed readers how the S&P 500 might be approaching a major top according to Elliott wave analysis.
Today, we look back to early 2007 when several analysts were looking for a similarly important top in the stock market indices. They then spent more than half a year watching the charts continue to creep up the “wall of worry” and push through price resistance areas.
As in 2007, it’s possible for the stock indices to prolong the topping process this year as well.
To show how this alternative scenario might play out, we prepared a weekly chart of the SPDR Dow Jones Industrial Average ETF Trust (NYSEARCA: DIA). The clue suggesting that the index might undergo a prolonged topping process lies in the elliott wave pattern up from the October 30, 2020 low.
The simplest Elliott wave scenario for the climb from the wave (iv) October low would involve a five-wave impulsive pattern that reaches new highs. However the actual climb doesn’t look impulsive. It counts better as a three-wave move on weekly and daily charts, which suggests that we might be seeing the first segment of an ending diagonal pattern. (An ending diagonal should consist of five moves, but each move should be composed of three sub-waves.)
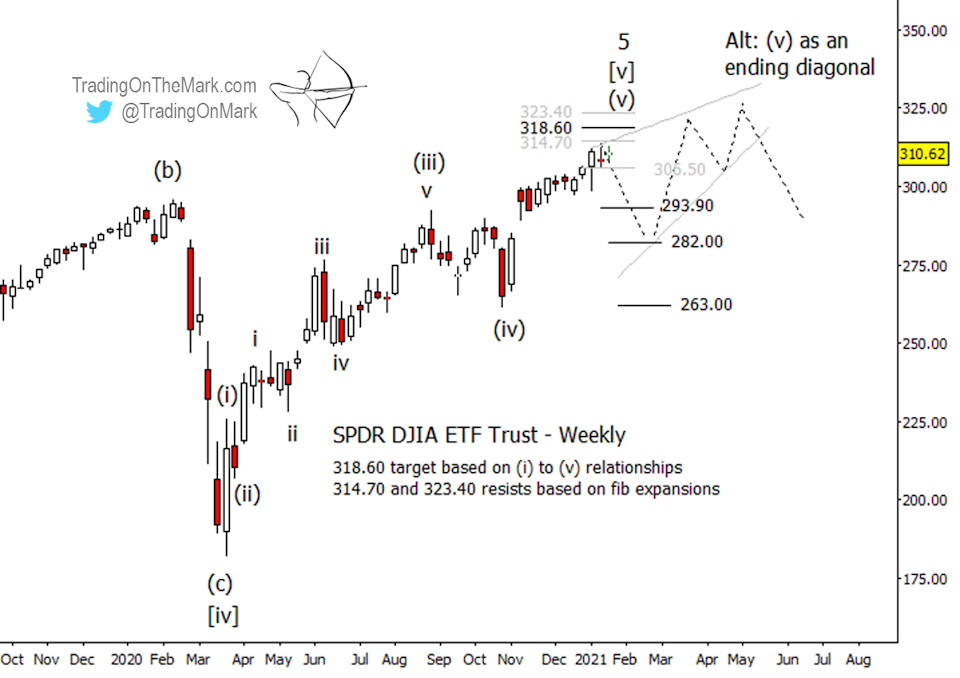
You’ll note that DIA has reached the first resistance level on the chart at 314.70, and there are other potential resistance areas nearby at 318.60 and 323.40. If the ending diagonal scenario is operating, we would expect one of those areas to put a halt to upward wave ‘i’ of the diagonal.
Continuing with the alternative scenario, a downward wave ‘ii’ retrace within the diagonal need not be deep. The first target area is near 293.90, although 282.00 appears more likely. Initial confirmation that a retracement (or a larger decline) is commencing would be a break and weekly close beneath 306.50.
The deepest support that a wave ‘ii’ retrace could test without invalidating the idea of an ending diagonal would be near 263.00. A break beneath the October low of 261.41 would entirely rule out the diagonal idea and would suggest that the top is already in.
Trading On The Mark provides detailed, nuanced analysis for a wide range of markets including crude oil, the S&P 500, currencies, gold, and treasuries. To celebrate the end of 2020 we’re offering a special 20% price reduction for all subscriptions begun before January 31. The coupon code is “holly”. See our website for details.
Twitter: @TradingOnMark
The authors may have a position in the mentioned securities at the time of publication. Any opinions expressed herein are solely those of the author, and do not in any way represent the views or opinions of any other person or entity.


