The stock market bounce off last fall’s low has kept investors hopeful that the worst is over.
But a recent sell signal on the Dow Jones Industrial Average could upend those hopes… if support doesn’t hold.
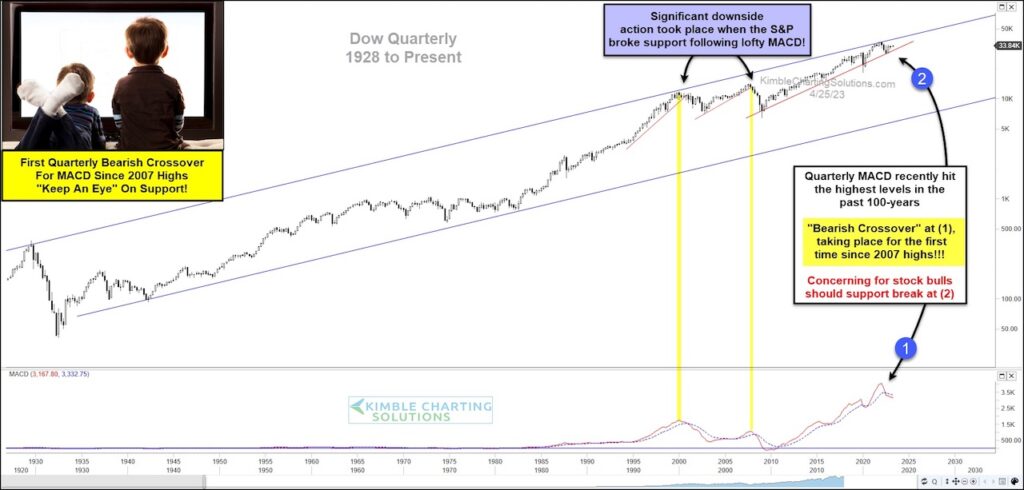
Below is a long-term “quarterly” price chart of the Dow Jones Industrial Average. As you can see, this key stock market index has been in a long-term rising uptrend channel. And more recently been touching the upper boundary of that channel (resistance).
This resistance marked the last top for the Dow Industrials and the subsequent sell off has produced a sell signal on an important technical indicator — The quarterly MACD is crossing over, from the highest levels in history at (1). Yikes!
This bearish crossover will be extra concerning should another selloff begin here. If so, investors should turn their attention to the up-trend support line off the financial crisis lows at (2). This marks important technical support. In my humble opinion, this support level will be critically important for the Dow Industrials to hold. Stay tuned!
Dow Jones Industrial Average “Quarterly” Chart
Note that KimbleCharting is offering a 2 week Free trial to See It Market readers. Just send me an email to services@kimblechartingsolutions.com for details to get set up.
Twitter: @KimbleCharting
Any opinions expressed herein are solely those of the author, and do not in any way represent the views or opinions of any other person or entity.

: Showing Some Signs of Emerging Strength")
