Following the stealth October stock market correction (which may or may not be over), I spent some time looking at the Dow Jones Industrial Average.
I find this particular stock index important right now, as the rest of the world has been “lagging” U.S. stocks and many international investors see the Dow Jones Industrials as the visible U.S. index.
The main concern right now is that it stops holding up the world and follows international stocks lower…
I focus on the S&P 500 as more of a domestic bellwether and the Nasdaq as a growth/beta indicator.
Today, it’s about the global stock markets. So the focus is on the Dow.
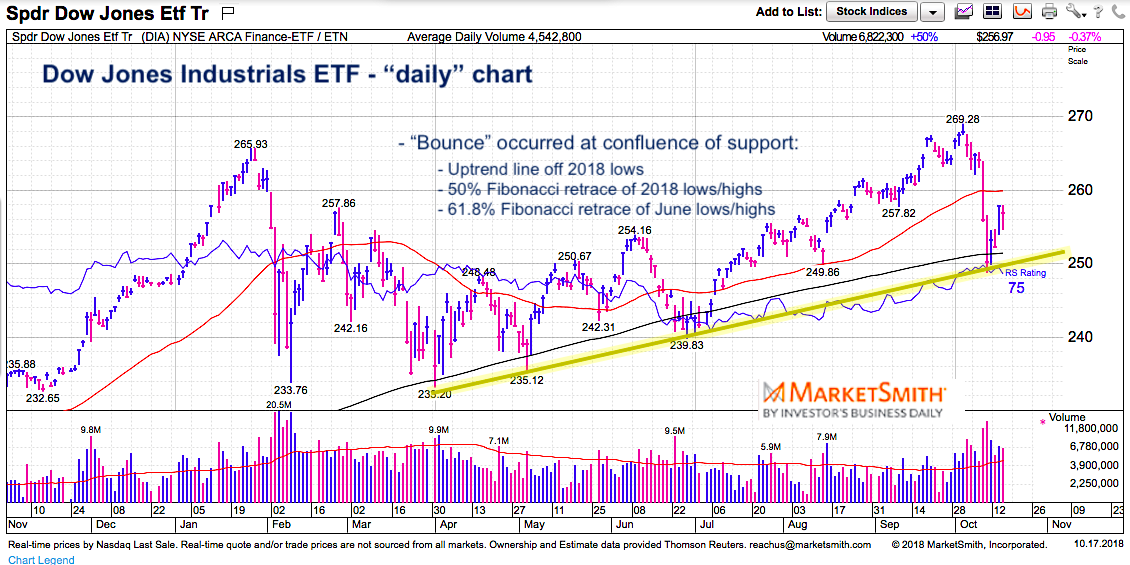
Below is a chart of the Dow Jones Industrials ETF (NYSEARCA: DIA) that highlights a key confluence of support that stopped the recent free fall… and gave birth to the “bounce”.
That confluence of support includes:
- The uptrend line off the 2018 lows.
- The 50% Fibonacci retracement of the 2018 lows to highs.
- The 61.8% Fibonacci retracement of the June lows and 2018 highs.
A retest may be in order… and perhaps a minor undercut. But bulls don’t want to lose this for more than a day or two. Put it on your radar.
$DIA Dow Jones Industrials ETF “daily” chart
The chart above was built with Investors Business Daily’s product suite. I’m also an Investors Business Daily (IBD) partner – you can gain access here.
Twitter: @andrewnyquist
The author does not have a position in mentioned securities at the time of publication. Any opinions expressed herein are solely those of the author, and do not in any way represent the views or opinions of any other person or entity.


