The history of the Dow Jones Industrial Average (INDEXDJX:.DJI) is one built on ups and downs.
But more ups than downs over the long-run.
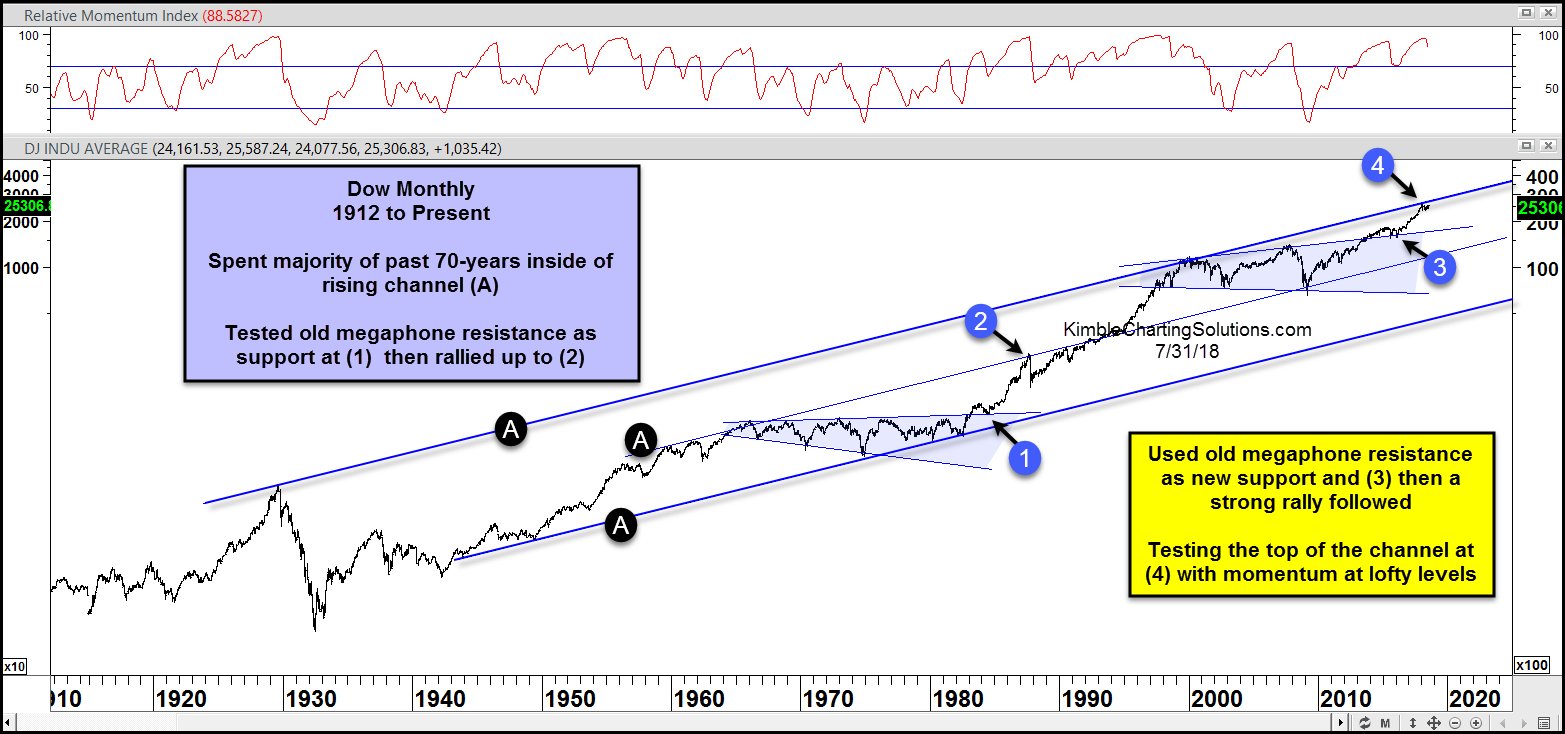
In the chart below, we look at the price action over the past century. For the majority of that time (roughly 70 years), the Dow Industrials has traded within a long term trend channel, splitting time in the upper and lower half (A).
This broad stock market index formed megaphone patterns in both the 1960s/70s/80s and the 1990s/00s/10s. And in both cases, the Dow Industrials broke out above the megaphone pattern, retested its breakout (points 1 & 3), then rallied to test the underside of its longer term rising trend channel resistance (points 2 and 4).
Clearing long-term rising channel resistance may take some time. The last time this occurred was in the 1980s, and shortly thereafter we saw the 1987 crash.
The market quickly recovered and chopped against this resistance line for nearly 10 years before breaking out in the 1990s.
If this pattern repeats itself, it likely means a choppy period ahead for investors, even if the market manages to push higher.
As well, current momentum readings are at lofty levels.
It could take some time before we see the Dow Jones Industrials definitively break out again!
Note that KimbleCharting is offering a 30 day Free trial to See It Market readers. Just send me an email to services@kimblechartingsolutions.com for details to get set up.
Twitter: @KimbleCharting
Any opinions expressed herein are solely those of the author, and do not in any way represent the views or opinions of any other person or entity.


: Showing Some Signs of Emerging Strength")
