I recently heard Art Cashin on CNBC talking about the importance of the 400 day simple moving average. Note that this is roughly the same thing as the 20 month moving average (for those that use it).
This got me thinking about its importance to stocks as well. So I pulled up a Dow Jones Industrial Average (DJIA) chart and applied both my pivot technique and the 400 day moving average.
Here’s a couple things I found that may have implications for the stock market’s next move.
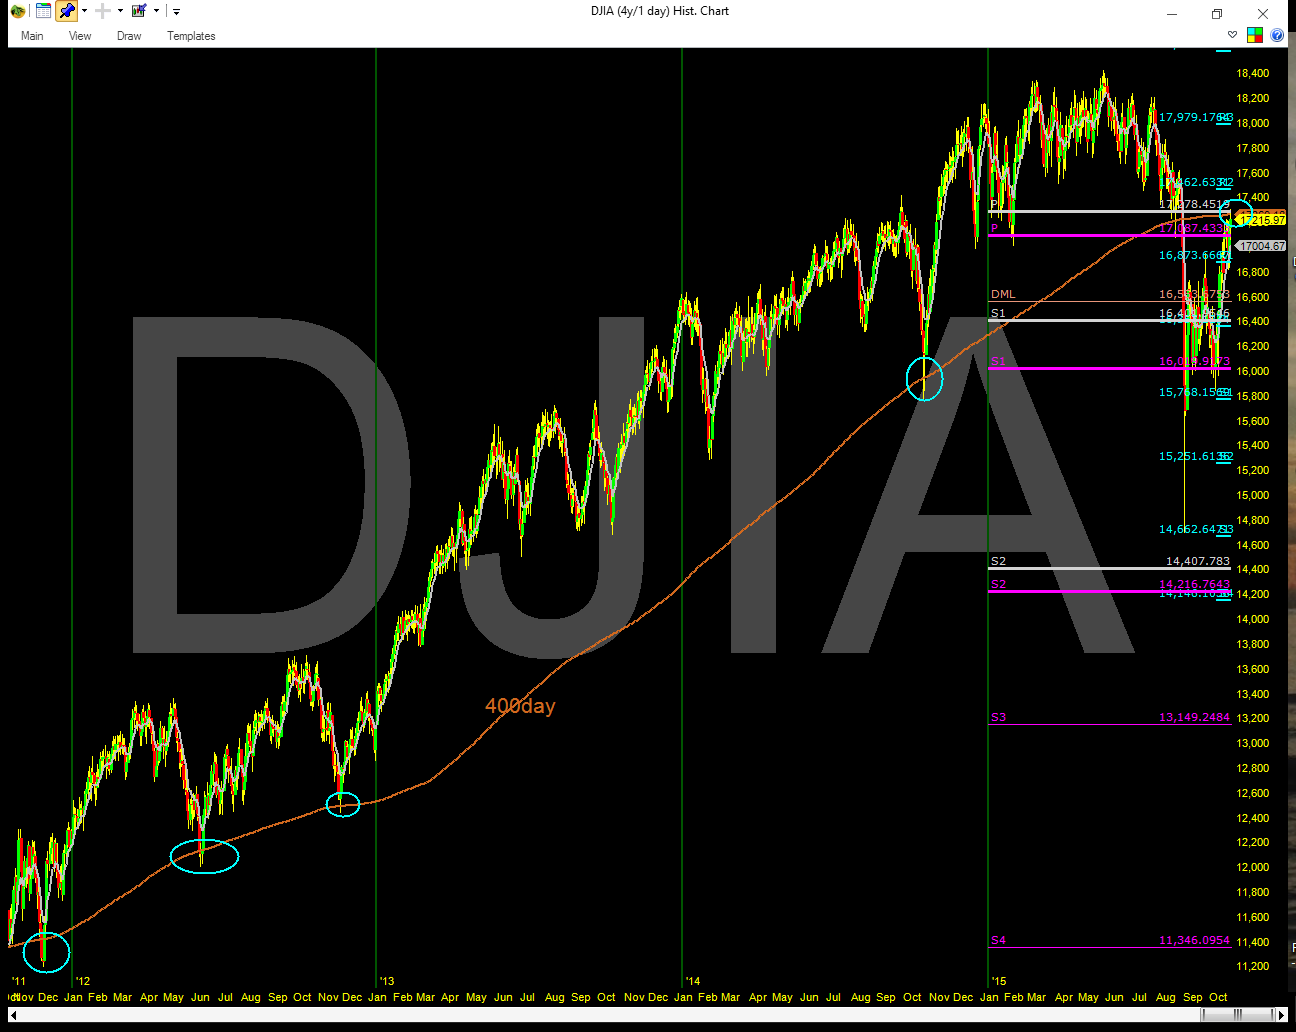
Looking back on a daily chart I could see that the 400 day moving average has been strong support since 2011. In August it failed to hold and prices declined very fast to the August lows. On the heals of a big rally, the DJIA is back at the 400 day moving average (as of Friday’s close).
So as they say, stocks are back to the scene of the crime! click charts to enlarge
Dow Jones Industrial Average Chart – 400 Day Moving Average
This is particularly interesting because the Yearly YPP zone also served as support for the first 7 months of this year. Will the YPP zone and 400 day now prove to be strong resistance?
Dow Jones Industrial Average Chart – With Yearly YPP Pivot (now resistance)
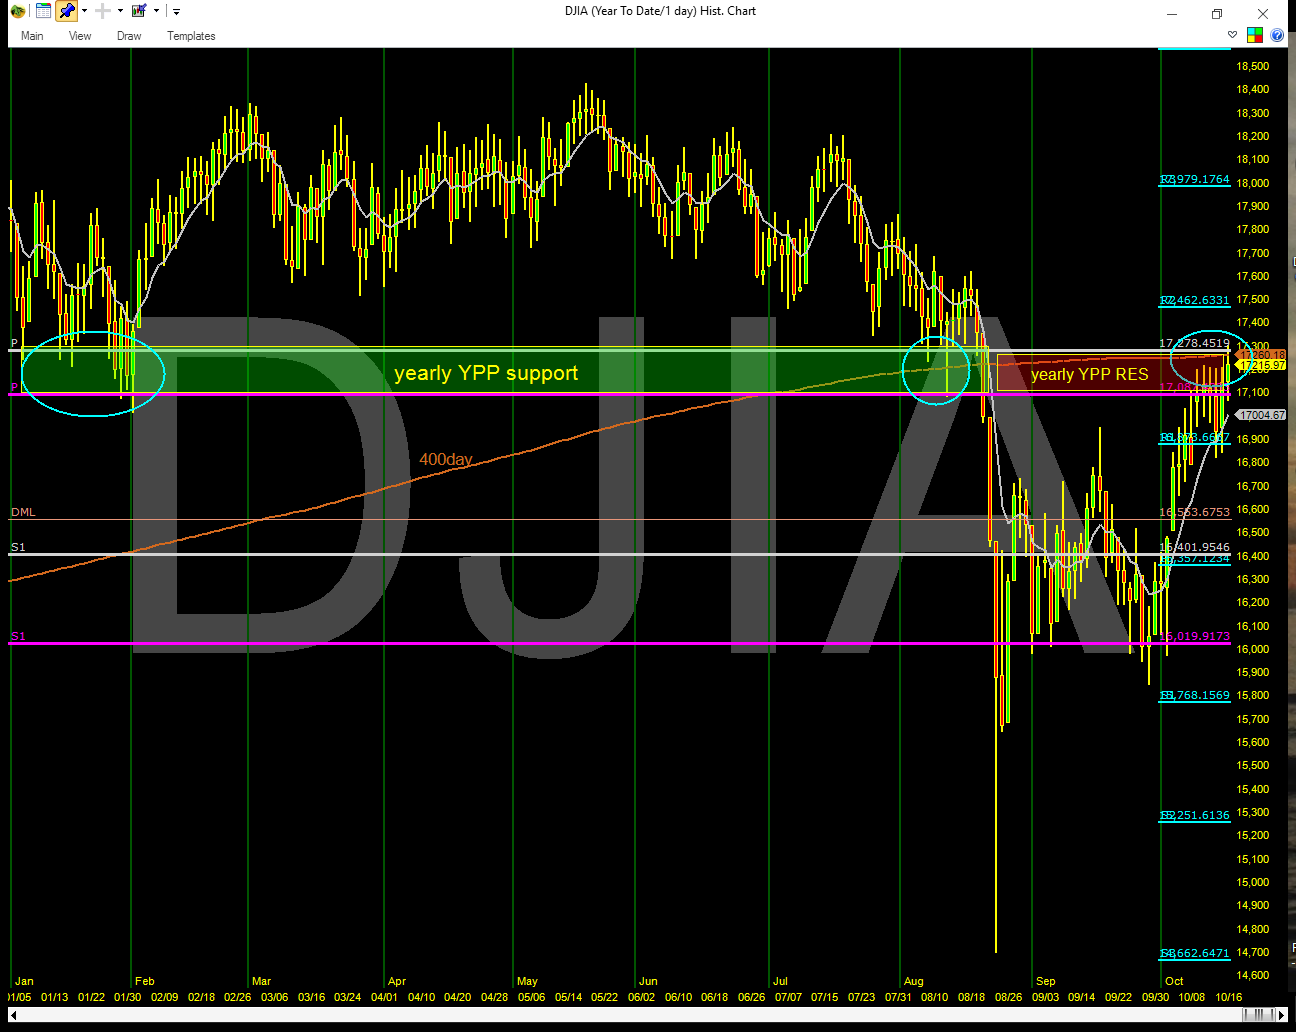
Whether the DJIA fails at this level or breaks out above it, this should be an interesting week for the stock market. Or putting it another way: If we are going fail again, this would likely be the place!
Have a great weekend and thanks for reading.
Twitter: @mpgtrader
The author does not have a position in any mentioned securities at the time of publication. Any opinions expressed herein are solely those of the author, and do not in any way represent the views or opinions of any other person or entity.
: Creating Bullish Divergence?")


 and Semiconductors (SMH): Concerning Price Pattern?")


