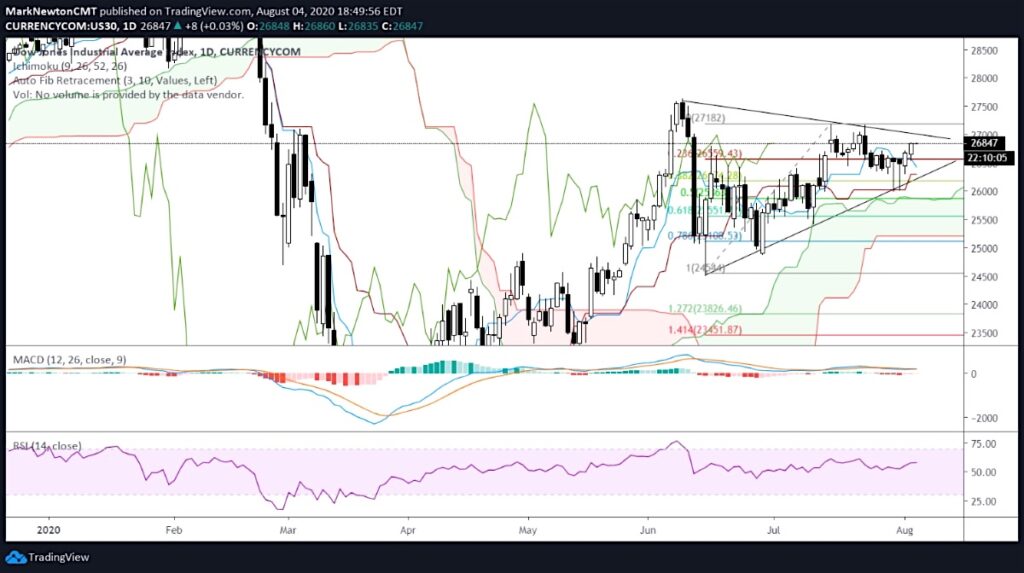
Dow Jones Industrial Average Chart
The Dow Industrials have been lagging both the NASDAQ Composite and S&P 500 Index.
But it looks like the Industrials are ready to play some “catch-up”.
Many are noting the underperformance along with Apple’s (AAPL) upcoming 4/1 stock split as reasons for further lagging.
However, the Industrials typically have a good correlation with the S&P 500. As well, the current pattern resembles a bullish Triangle pattern which is likely to be resolved higher before any stalling out period for the broader market.
I think it’s right to overweight the Dow Industrials and expect a push higher to test June highs into mid-August.
If you have an interest in seeing timely intra-day market updates on my private twitter feed, please follow @NewtonAdvisors. Also, feel free to send me an email at info@newtonadvisor.com regarding how my Technical work can add alpha to your portfolio management process.
Twitter: @MarkNewtonCMT
Author has positions in mentioned securities at the time of publication. Any opinions expressed herein are solely those of the author, and do not in any way represent the views or opinions of any other person or entity.


