Stocks are attempting to rebound after a brutal start to the year.
And the Dow Jones Industrial Average looks poised to deliver a bullish breakout.
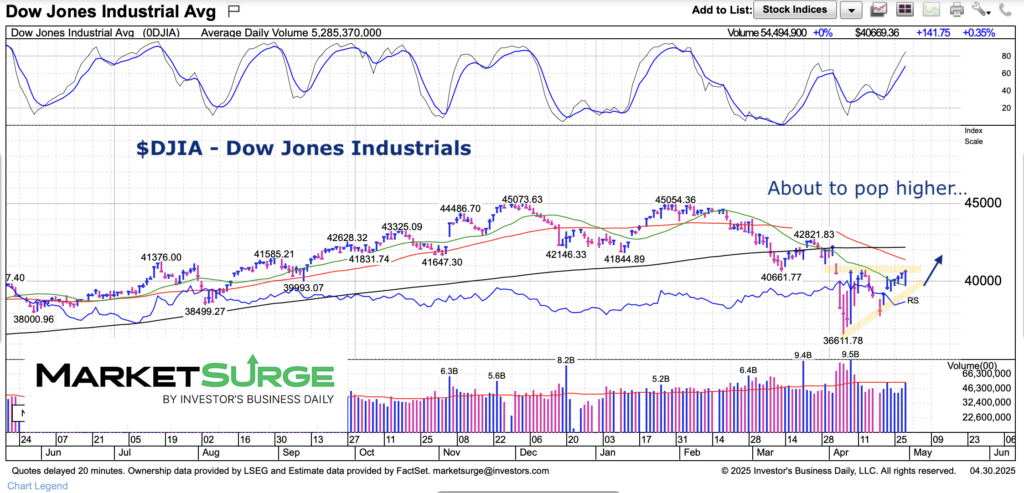
As usual, today’s chart is simple and we let the price action do the talking.
Thus far, the Dow Industrials have regained momentum (top pane of chart) while forming a top pressure ascending triangle.
Note that the following MarketSurge charts are built with Investors Business Daily’s product suite.
I am an Investors Business Daily (IBD) partner and promote the use of their products. The entire platform offers a good mix of tools, education, and technical and fundamental data.
$DJIA Dow Jones Industrial Average “daily” Chart
A move over 41000 should bring a quick move to the 42,500 (200-day moving average) to 42,800 area (March highs). From there it gets trickier. We take it one step at a time.
Twitter: @andrewnyquist
The author may have a position in mentioned securities at the time of publication. Any opinions expressed herein are solely those of the author, and do not in any way represent the views or opinions of any other person or entity.
")


")
