Wall Street sold off dramatically on Friday after the jobs report.
While the economy is stagnating, many investors are concerned that the Fed will raise rates too quickly, pushing the U.S. economy into a deep recession.
It is good to stay current on the unemployment rate and Fed policy. However, Mish’s Modern Economic Family, composed of a few stock symbols, can serve as a valuable guide to market conditions and the next potential trend.
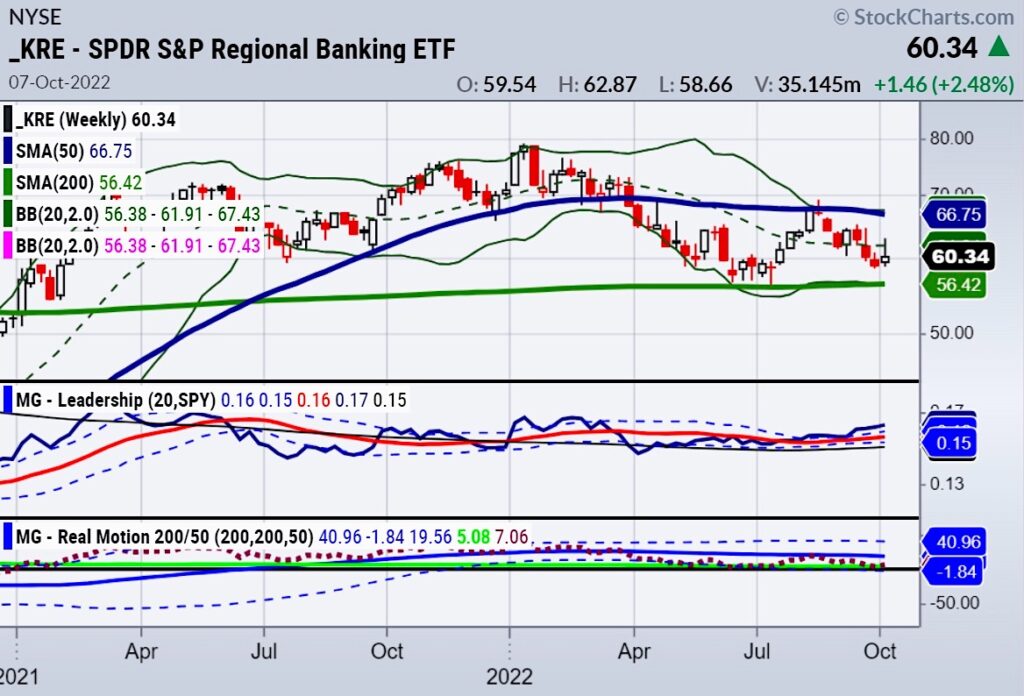
This weekend, we are looking at the weekly Modern Family charts to gain insight and KRE displayed above is one of the family members.
What is the Modern Family telling us about trading next week?
The Modern Family consists of the small-cap Russell 2000 index (IWM), Transportation (IYT), Retail (XRT), Regional Banking (KRE), Biotech (IBB), and Semiconductors (SMH).
Each family member is in a bearish phase on the daily charts.
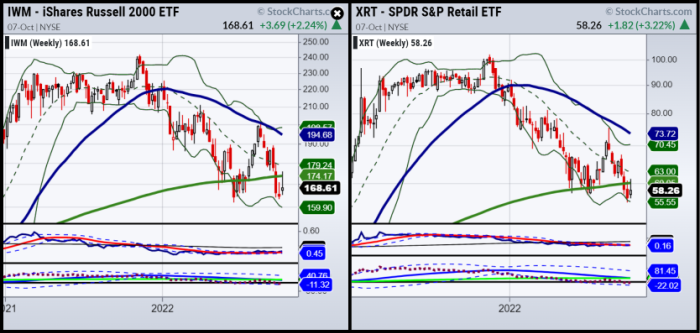
Looking at the weekly charts, the Russell 2000 (Grandpa) touched the 50-week moving average in the middle of August and then broke down through the 200-week moving average.
The 200-WMA, past support, looks like critical resistance for Grandpa. A move over the 200-WMA of 178 would be a bullish sign.
Just like Grandad, Granny Retail (XRT) also closed at a higher weekly low on Friday. Granny also outperformed the broader market and ended up 3.22%. She is at 58.05 and needs to clear 61.79, the 200-week moving average, to regain shopping strength.
Granny (XRT) has unfavorable macro and micro headwinds against her, making a swift recovery difficult.
Transportation (Trans) IYT has followed a similar weekly pattern, but once the 200-week moving average was crossed in late September, IYT put in a much lower low and only a slightly higher low for the first week of October at 200, below the 200-WMA at 214.
Biotechnology (Big Bro, IBB) dropped considerably in late August and broke its 200-WMA. IBB has since closed at higher weekly lows. IBB outperformed the broader market, up 1.61% for the week.
The FDA’s approval of medications and encouraging clinical data have helped the industry. IBB must surpass the 200-WMA at 130 at its current price of 118 to keep gaining strength and momentum.
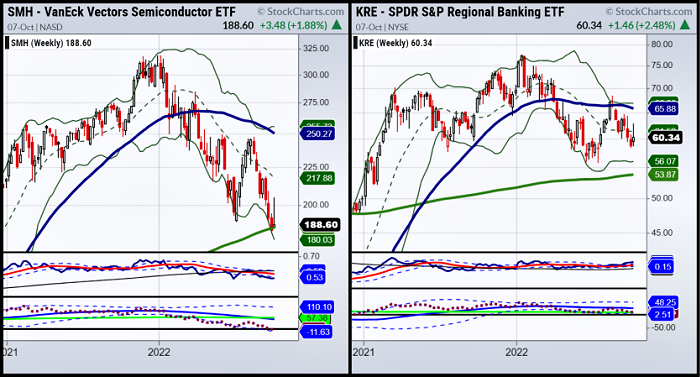
Semiconductor Sister (SMH) is hugging the 200-week moving average and could have found a bottom or a temporary rest stop. Semis are a critical industry for decades to come, but considerable downside risk exists today.
Monitor SMH’s price closely for a clearer indication of further market declines or for a potential mini-recovery next week.
Regional Banks (Prodigal Son, KRE) closed at a significant higher weekly low and is the only family member who is decisively far above the 200-week moving average.
KRE finished up 2.48% for the week. A rising rate environment should provide continued uplift and strong support for regional banks.
Due to the weakening economy, inflation, rising energy costs, higher rates, and a modest decline in employment, the stock market is incredibly vulnerable.
To keep up with the Modern Economic Family and profitably trade amid market turbulence, subscribe below to Mish’s Daily for more market insights.
Mish’s Upcoming Seminars
ChartCon 2022 Stockcharts October 7-8th Seattle.
Join Mish and 16 other elite market experts for live trading rooms, fireside chats, and panel discussions.
October 7th 11:15 AM (ET), 8:15 AM (PT) Stock Picking Lightning Round with Mish
October 8th 2:00 PM (ET), 11:00 AM (PT) Bulls vs. Bears Debate with Keith and Mish on opposing sides of a trade!
The Money Show, October 30 – November 1
Join Mish and many wonderful speakers at the Money Show in Orlando beginning October 30th running thru November 1st. Spend Halloween with us! Use either link to join Mish there!
Trader’s Summit, October 21-23
Mish speaks with Helene Meisler on October 23rd at 12 ET.
Trader’s Summit.
Stock Market ETFs Trading Analysis & Summary:
S&P 500 (SPY) 358 support and 365 resistance
Please note previous first level of support listed for Friday was 371 and Friday’s high was 373 before closing at 362.79
Russell 2000 (IWM) 166 support and 171 resistance
Dow (DIA) 290 support and 296 resistance
Nasdaq (QQQ) 266 support and 272 resistance
KRE (Regional Banks) 59.22 is now support and 61.70 resistance
We had listed support at 60.30 for Friday and sold off to 60.34 on Friday’s close right around support.
SMH (Semiconductors) 185 support and 192 resistance
IYT (Transportation) 198 support and 203 resistance
IBB (Biotechnology) 116.59 is now support and 120 resistance
We had listed support at 119.32 on Friday and sold off to 118.84 on Friday’s close right around first level of support.
XRT (Retail) 57 is now support and 60 is resistance. We had listed support at 58.38 and sold off to 58.26 on Friday around first level of support.
Twitter: @marketminute
The author may have a position in mentioned securities at the time of publication. Any opinions expressed herein are solely those of the author and do not represent the views or opinions of any other person or entity.


