Often times the financial media will appear to imply correlations and causes to movements in stock prices when there is no statistical evidence backing them up. I understand why the media would do this – they need to tell a good story to keep their audience. One such example is the US Presidential Election race currently taking place and how it may be affecting stock prices (and the stock market in general). Particularly, in regards to Donald Trump’s presidential prospects.
I will try to keep this analysis somewhat brief. However, if there are enough questions or interest, I can turn this into a research paper that digs deeper into the nuances of the data, methods, and studies.
Trump’s POTUS Prospects and Stock Prices
I gathered data on various stock ETFs as well as data on Donald Trump’s election prospects via the PredictIt.org online prediction market (May 31, 2016-September 16, 2016). PredictIt was kind enough to send me historical data of their markets.
For those who may be unaware, the PredictIt market is an online marketplace where individuals can bet on who they believe will win the 2016 Presidential Election, among other events. PredictIt is not a poll, which naturally lags reality, rather it is a real-time trading market, just as the stock market is a real-time market. I felt it was incorrect to use polling data to compare to stock prices because one is lagging and the other is real-time. I then took the data and ran some very basic statistical tests to see what correlations there may be between Trump’s perceived chances of winning the Presidential Election via the PredictIt market and the performances of various stock index ETFs.
In short, the results were mixed. Like many statistical tests, one can manipulate the tests to make the results fit a specific narrative. As Homer Simpson so eloquently put it, “you can come up with statistics to prove anything.”
I am simply looking to weigh the evidence and state conclusions. On some timeframes, there is a positive relationship between Trump’s prospects and stock prices, while others show a negative correlation. Still others show no statistical relationship. One consistent trend that appeared was a moderate negative correlation that persisted between Trump’s prospects and the performance of the iShares Mexico ETF (EWW).
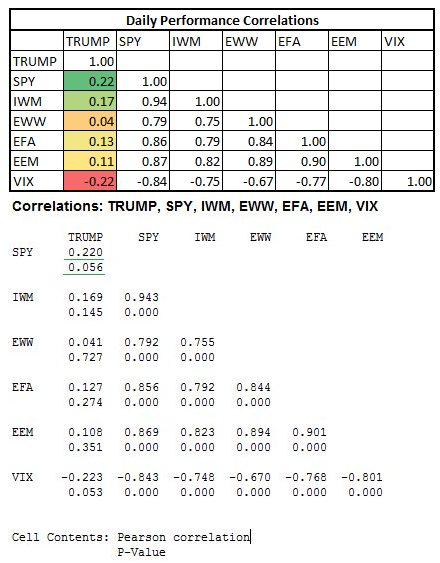
Now, onto the data. The first test I ran was looking at the daily performances of “Trump” on Predictit and the stock ETFs. In the graphic below, you will see there is statistically a weak positive correlation between Trump and large cap US stocks (NYSEARCE:SPY), small cap US stocks (NYSEARCA:IWM), international developed market stocks (EFA), and emerging market stocks (EEM). There is no statistical correlation between Trump and the Mexico stock market (EWW). There is a weak negative correlation between Trump and the VIX index. Statisticians generally use a p-value of 0.05 or 0.10 as the demarcation of a statistically significant relationship. In the simplest terms, the p-value indicates the confidence of the relationship – the lower the p-value, the greater the confidence. SPY and VIX have low p-values, but IWM, EFA, EEM have elevated p-values, and EWW’s is very high. Essentially, we cannot draw any relationship between Trump and EWW (and EFA and EEM) in this test.
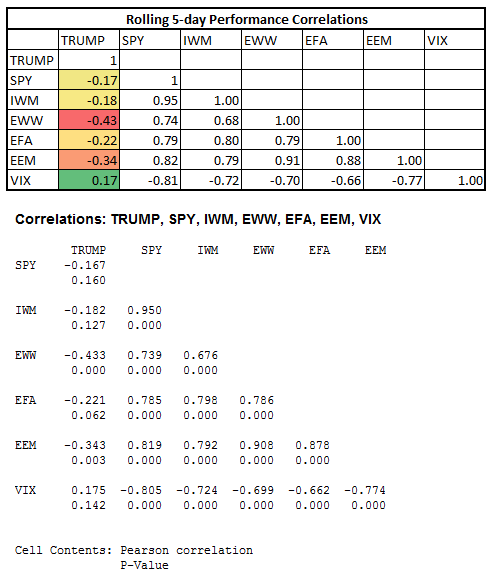
I wanted to see if these relationships held on different timeframes. They did not. When I back the timeframe from daily performances to rolling 5-day performances, I found that the correlations flipped. In the below graphic, you will see negative correlations on a rolling 5-day performance test. The only standout are the lower p-values for EWW, EFA, and EEM. Also, EWW shows a p-value near zero, indicating a moderate negative correlation with a very high degree of confidence.
In one more test, I pulled data only looking at end-of-week performances. I found that there was no correlation between Trump and US stocks. However, there was a negative correlation to international stocks, with very high p-values. So we likely cannot suggest a relationship between Trump and international stocks in this test. EWW, on the other hand, once again showed a moderate negative correlation with a low p-value (0.06).
Bottom line, since there are conflicting relationships across different timeframes, it is hard to conclude that there is a statistical relationship between stocks and Trump since May 31. The exception, however, is with the Mexico stock ETF – many timeframes show a statistically weak to moderate negative correlation between Trump and EWW.
This article is not intended to be a full-blown academic research paper on these relationships, so please excuse the lack of definition and detail in some of the data. I am open to constructive criticism on any methods, definitions, or relationships drawn that do not make sense to readers.
Thanks for reading.
Twitter: @MikeZaccardi
Any opinions expressed herein are solely those of the author, and do not in any way represent the views or opinions of any other person or entity.


