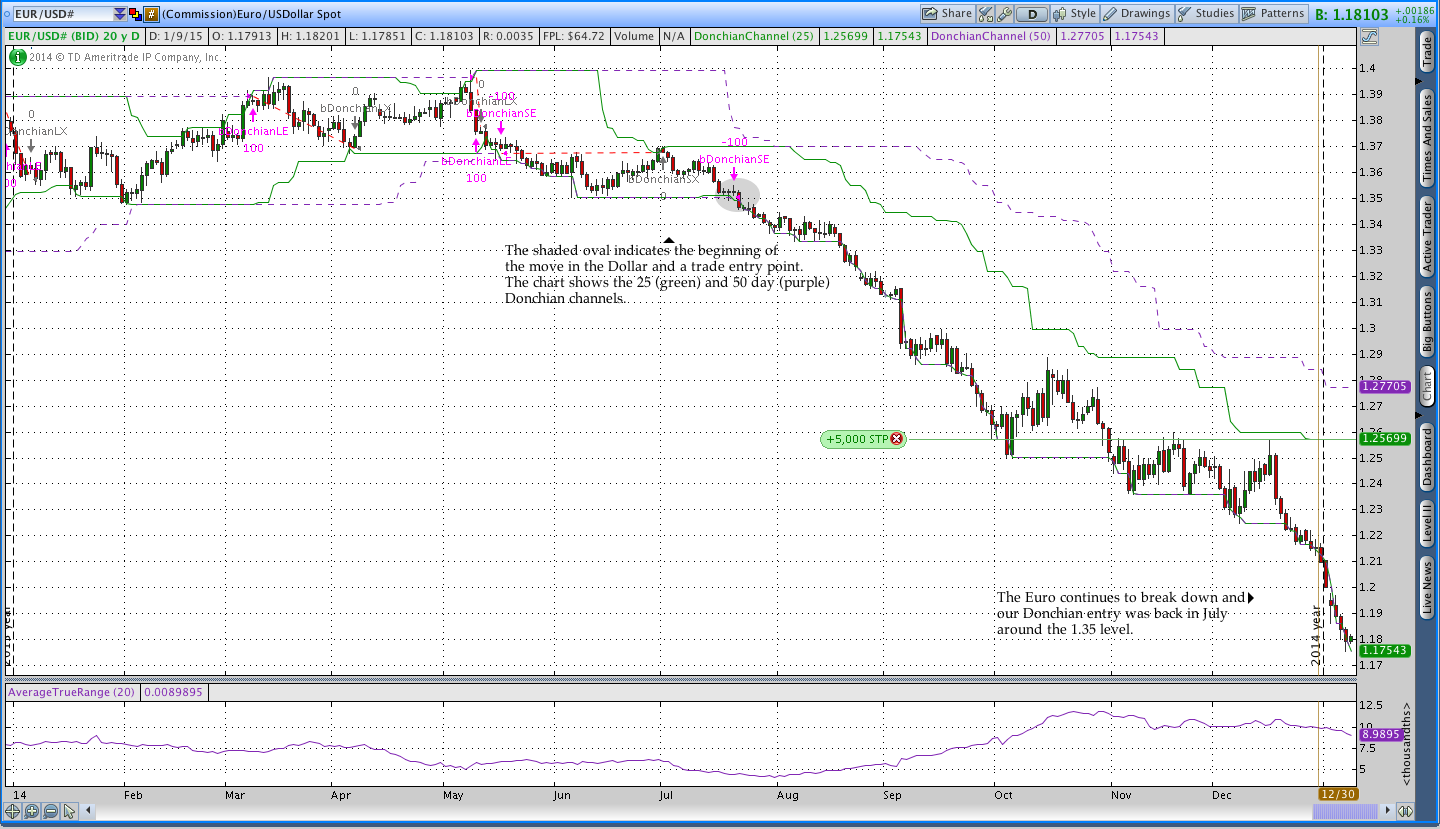
The US Dollar is strong and it’s been that way for a good part of 2014. Last summer we saw the beginning of the current US Dollar Index trend start to take shape when EUR/USD made a new 50 day low. That low triggered a Donchian channel breakout trade that we’re still riding down.
Since that time, we’ve seen the world get shaken up a little bit with a collapse in Emerging Equity Markets (see ETF: EEM), a good amount of strength in U.S. Treasury Bonds, and the decimation of most commodity markets. However, while we’ve continued to see weakness in the Euro over the past week, commodity markets don’t seem to be buying the move.
Euro 1 Year Chart – Downtrend
In the table below, we’re looking at list of Commodity ETF’s and a few major spot forex pairs. The chart shows us the Rate of Change for the ETF’s and Forex markets over several lookback periods: one week, one month, 3 months (13 weeks), and a 3, 6, 12 month average. The various performance periods give us a picture of how the markets are performing now relative to their recent and longer-term performance.
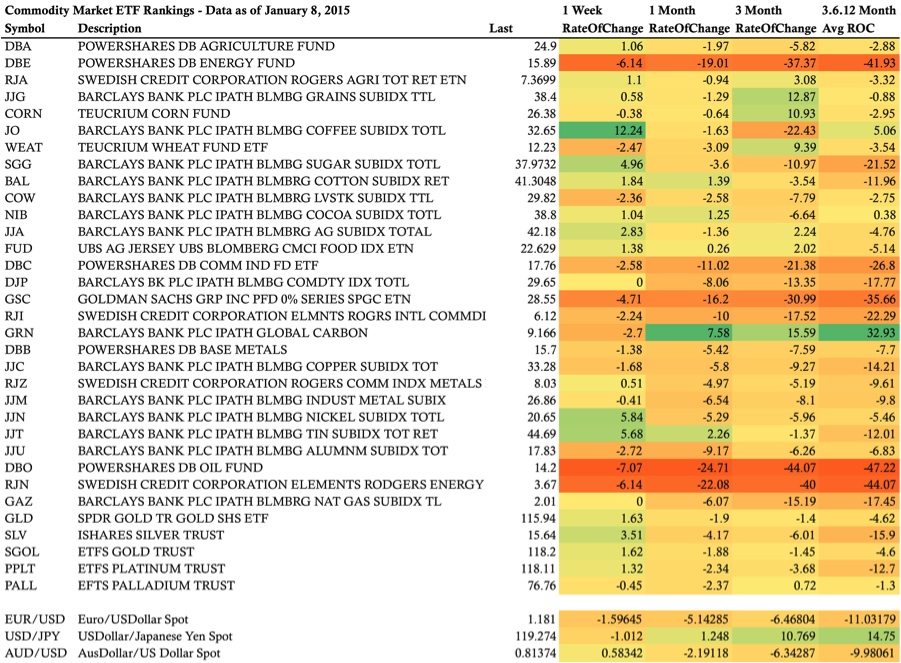
Commodity Market Clues
At first glance the chart looks pretty yellow, which generally indicates weakness. However, when we look at the weekly Rate of Change column on the chart we can see that the upside is being skewed by Coffee (JO) and that about half of the Commodity markets are up this week suggesting that the Dollar is taking it a little easier on them.
In general, Commodities are still weak, but the rate of that weakness slowed this week. As a reminder, the commodity markets we’re looking at are measured in Dollars so weakness in commodities suggests either weak commodity markets and/or a stronger US Dollar. The problem with using commodities as a barometer for the Dollar is that the markets are relatively small when compared to Equity, Bond, and Forex markets. Nevertheless, they’re worth considering.
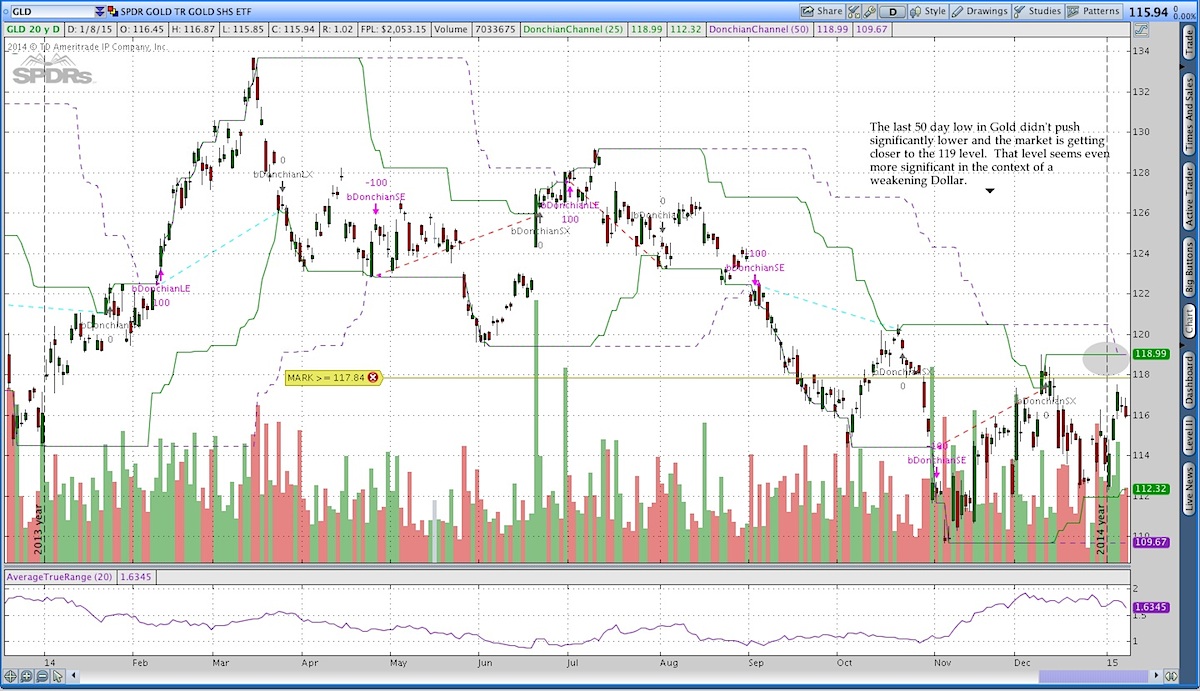
Gold in particular
Based on the performance numbers, the Gold market looks like it could be saying something about the short-term future of the Dollar. The descent of the ETF SPDR Gold Trust (GLD) has slowed significantly in the past 3 months after a couple of poor years. If the Gold market makes a meaningful breakout, it will be a big clue that things are shifting for the US Dollar Index. I’m closely eyeing the 50 day breakout level in Gold, which is around 119. See the chart below for reference.
Forex Markets
While the Euro has been weak over the past week, both the Australian Dollar and Japanese Yen are up against the US Dollar. That relative strength suggests that perhaps the Dollar isn’t as strong as much as the Euro is just weak. Keeping an eye on multiple Forex markets helps create a better context for what is really happening with a currency.
Overall, it’s too early to call an end to the strong Dollar, but there are some indications that things could potentially be shifting. Picking tops and bottoms is generally an exercise in futility punctuated by occasional periods of genius, but it is important to watch the flow of capital and the relative performance of uncorrelated markets. Fundamental information is the story about why markets are moving, however, the flow of capital as expressed by price is ultimately what moves markets.
If you’re interested in additional information about momentum based investing across a diversified group of markets, check out my Market Momentum Newsletter.
Follow Dan on Twitter: @ThetaTrend
Author holds positions in EURUSD, USDCHF, USDJPY, NZDJPY, SPX, IWM, IYR at the time of publication. Any opinions expressed herein are solely those of the author, and do not in any way represent the views or opinions of any other person or entity.


