DCommodities, even with the huge rally in equities, remain my major focus for 2019.
There are several reasons why.
First, the ratio between equities and commodities stands at a historical 100-year low.
Secondly, the Fed seems to be on hold for future rate hikes and the U.S. Dollar might have peaked.
Third, It’s been 40-years since we have had a good commodities run.
Gold (GLD) has already shown its hand as far as an early-warning inflation indicator. And this week, sugar started to sweeten, taking out a key weekly moving average.
I’m convinced that there is very little upside left in equities (see ETF commentary below), and tons of potential upside in commodities.
Although not my first choice of indicators to trade, United Sates Commodity Index Fund (USCI) is a great chart to show you, as its components comprise a wide range of futures.
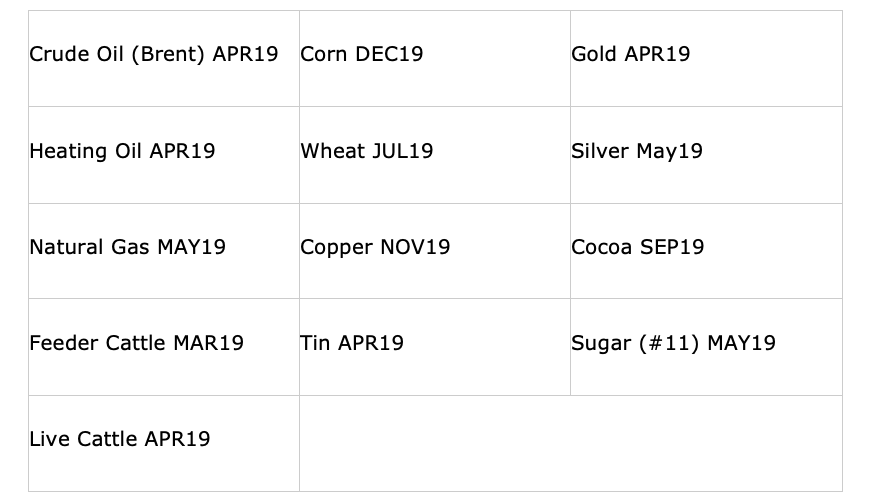
For the month of February, the Benchmark Component Futures Contracts are:

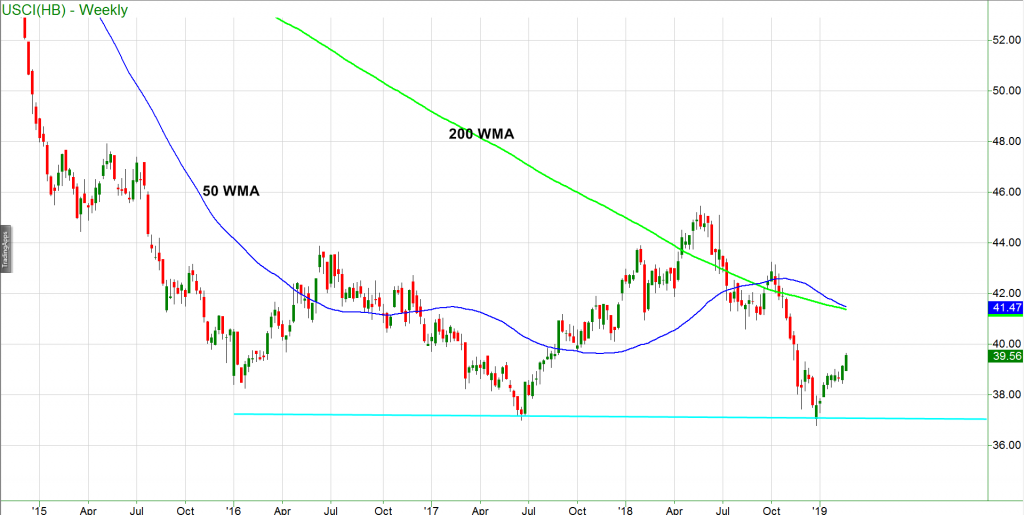
The weekly chart of the US Commodities Index Fund (USCI) shows that there was a significant double bottom made in Spring 2017 and late 2018.

The overhead resistance begins at 40.00. However, through that level, it can easily see its way to test both the overhead weekly moving averages and beyond. (200-WMA green and 50-WMA blue.)
USCI trades only 51.7K shares a day. So, it may not be the perfect instrument liquidity-wise, but it is a very reliable indicator of commodity performance.
More importantly, you can use this indicator to help you track the future of futures-38.00 is the best underlying support.
Should it clear 40.00, I would consider that another confirmation of a bottom, and confirmation we will see that historical low ratio narrow.
S&P 500 (SPY) – 280.40 the last December swing high before the crash. 276.00 is the important support to hold on a closing basis
Russell 2000 (IWM) – November 8thhigh 157.90 is now pivotal. It’s also where the 200-DMA is. Since it managed to close above, 157.90 pivotal for Monday on a closing basis.
Dow Jones Industrials (DIA) – 260.30 was the last swing high before the crash. Friday high 260.40. Since it closed below both, we watch for weakness under 258.70 then 256.25. Otherwise, we hold steady.
Nasdaq (QQQ) – 172.02 the 200-DMA pivotal.
KRE (Regional Banks) – 58.18 the 200 DMA overhead with 56 the best underlying support
SMH (Semiconductors) – 104-105 resistance met on Friday with 102 the immediate area to hold.
IYT (Transportation) – This closed red but held the 200 DMA. That makes 190.20 pivotal and 189.71 the 50-WMA the next big area to hold and if it cannot, could be it for the bulls.
IBB (Biotechnology) – 109.83 the pivotal point.
XRT (Retail) – 44.67 pivotal for the week.
Twitter: @marketminute
The authors may have a position in the mentioned securities at the time of publication. Any opinions expressed herein are solely those of the author, and do not in any way represent the views or opinions of any other person or entity.


