This week’s important “One Chart” highlights the Zweig Breadth Thrust indicator, named after Martin Zweig.
It’s basically a different way to think about stock market breadth.
It triggers when stocks are beaten down (when market breadth has been weak) then they reverse to be positive fairly quickly.
This chart essentially looks at the number of advancers- the number of stocks on the NYSE closing up on the day- relative to the total number of stocks.
It looks at these advancers and takes a 10-day exponential moving average of that daily breadth reading.
That’s the green line you see on the chart.
When market breadth is weak, it goes below .4 using that calculation (so less than 40%), remembering that the green line is the exponential moving average. Once it goes back above that .4 level and gets above the .61 level in 10 trading days or less (2 trading weeks), we get a breadth thrust buy signal. Simply, breadth is relatively weak then it quickly turns around and becomes more positive.
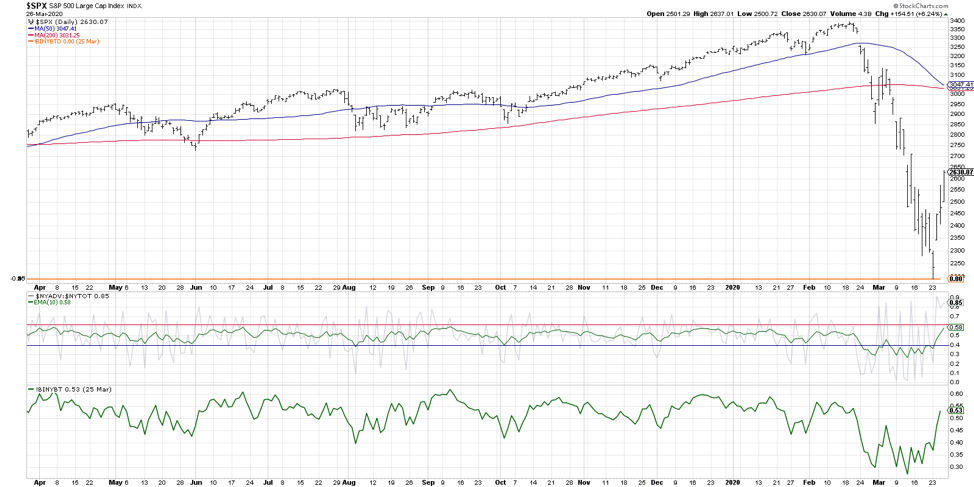
But looking at the last year you can see this has not happened very often- the main reason being that breadth has not been negative. If you look back, it’s rare that it even went anywhere near the lower .4 level.
However, if we back up the chart a little further and go back say 20 years, you can see it happened six times. Most of the time this has led into a bull market move. I would say 100% of the time the market has been stronger one year after the trigger.
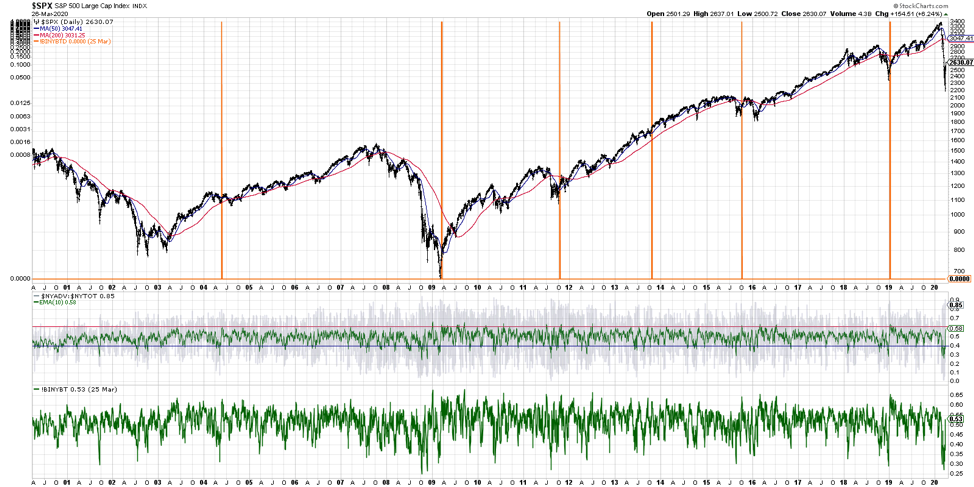
In a couple of instances, in 2004 and again in 2015, this was earlier on in the correction phase. There was a rally, a subsequent pullback, then a resolution to the upside, but most of the time this was the beginning of a broader advance. The most recent example was after the December 2018 market low. The market rallied and we got the breadth thrust buy signal then we continued higher for the next 8 or 9 months.
This is such an important chart because although it hasn’t triggered yet, we are starting to line up with some of those previous heavy thrusts higher out of a weakened breadth environment. If we exceed that .61 level, it would be wise to start making comparisons to the previous cycles where, after 6-12 months, you would be pretty happy being a buyer there.
To watch this in video format, just head over to my YouTube Channel!
Twitter: @DKellerCMT
The author does not have a position in mentioned securities at the time of publication. Any opinions expressed herein are solely those of the author, and do not in any way represent the views or opinions of any other person or entity.


