TLT 20+ Year Treasury Bond ETF “monthly” Chart
Treasury bonds have seen some wide swings over the past 15 years, but have remained in a bull market.
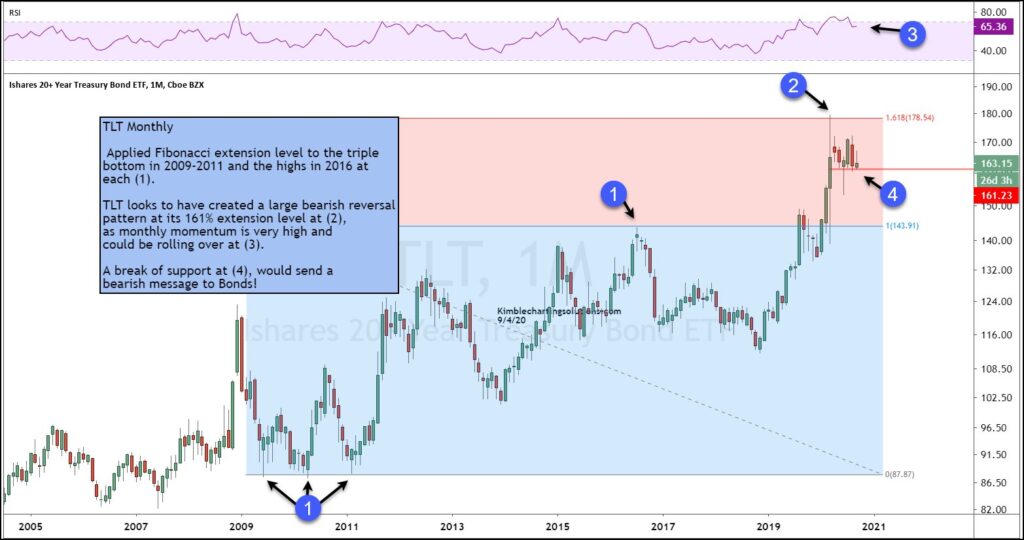
In today’s chart, we highlight why treasury bonds are nearing an important price support… one that could confirm a top is in place.
Using markers from the 2009-2011 bottom to the 2016 top at each (1), we saw price breakout higher to the 1.618 Fibonacci level at (2) during the initial coronavirus crash in February. That surge higher was sold and created a large monthly bearish reversal candle.
At the same time, momentum reached extreme levels and has since rolled over at (3).
TLT is now testing an important support level that, if broken, would send a bearish short-term message to bond investors. Stay tuned!
Note that KimbleCharting is offering a 2 week Free trial to See It Market readers. Just send me an email to services@kimblechartingsolutions.com for details to get set up.
Twitter: @KimbleCharting
Any opinions expressed herein are solely those of the author, and do not in any way represent the views or opinions of any other person or entity.

")


 Rolling Over At Key Fibonacci Level?")