Dick’s Sporting Goods (DKS) is up 5% on Monday morning.
This is happening the day before releasing its earnings results for Q4 2017, which includes a quarter dominated by holiday shopping for many retailers.
Wall Street expectations are for earnings per share of $1.20 and total revenue of $2.73 billion.
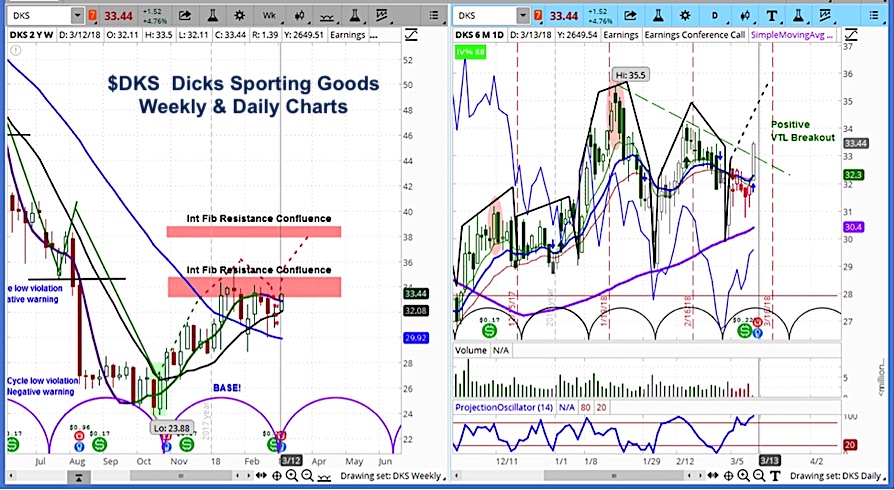
DKS has a strong technical pattern, upon reviewing the charts below. This includes an analysis of its market cycles, which are designated by the semicircles at the bottom.
The weekly chart on the left suggests the stock has formed a base and turned upward at the estimated timing for the cycle low.
The daily chart on the right shows a new high for the cycle. It has also broken out from below a valid trend line, represented by the dotted green diagonal sloping down and to the right. This indicates resistance near $38.
Dick’s Sporting Goods (DKS) Stock Charts – Weekly (Right) and Daily (Left)
For a more detailed look at cycle analysis for a broader selection of futures, watch the askSlim Market Week every Friday afternoon, or subscribe to our YouTube channel.
Twitter: @askslim
Any opinions expressed herein are solely those of the author, and do not in any way represent the views or opinions of any other person or entity.


