On the daily charts, the Russell 2000 IWM broke down on September 26th, when it closed below the 50 DMA and into a Warning Phase.
Then, last week, the first breakdown on the weekly chart confirmed under a key exponential moving average.
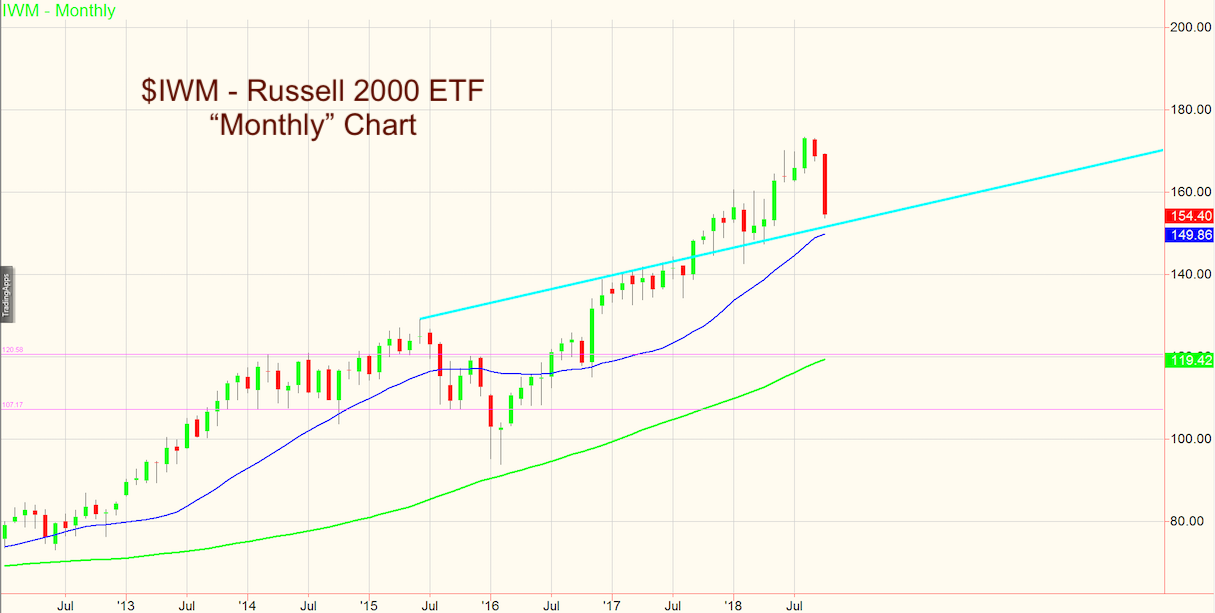
This week, IWM broke the 50-week moving average for the first time since March 2016!
Hence, we go out further to the monthly charts.
What can we gleam from IWM’s monthly chart as well as on the other indices?
The number of stocks under the 10-Day moving average in the S&P 500 hit an extreme. So did the new highs/new lows ratio.
The relative strength indicators are also at extreme oversold-both on the Daily and the Weekly charts.
That channel line you see (cyan) dates back to 2013.
The channel line in the SPY monthly chart goes back to 2007. It broke out in early 2017.
However, unlike IWM, the channel in SPY is still a good distance from its current price.
As the closest to the channel, that makes IWM key once again.
Bottom line is this. Buying because things are cheap is a mistake.
Rather, now that IWM is in a Distribution Phase on the Daily and a Warning on the Weekly, we can look to the monthly for guidance.
That means, 150 area is rock bottom support to hold.
What to look for now:
- Some sort of bottoming formation on the daily (ahead of 150)-a classic reversal pattern with confirmation-til then don’t take a risk.
- Then, if we get good volume buying, after days of negative floor trader pivots, we need a close above R1.
- If no bottoming pattern (no reversal but could still digest with an inside day or some level of consolidation), watch for a move near 150.
- If number 3 happens, then watch for a bounce, which could be more of a deadcat bounce. If so, that will be the bounce to sell into.
And while you are watching, remember, I’ve written a lot about commodities. Today gold miners rallied over 6%.
The dollar declined and rates eased. The historical low ratio between stocks and the dollar is intriguing. Keep your eyes there.
Key level across the major stock market ETFs:
S&P 500 (SPY) – Well, we did not exactly get a V-bottom. What we did get was a shallow bounce and more downside. 273.89 is the 50-Week MA this closed just below-if recaptures by end of day, some relief.
Russell 2000 (IWM) – 150 is next best level. Unless it closes with some reversal pattern.
Dow (DIA) – 249.56 is this index’s 50-WMA-and so far holding.
Nasdaq (QQQ) – 168.69 the 50-WMA.
Regional Banks (KRE) – Ugly-and our Prodigal has the distinction of being the first one in the Family to break that 50-WMA.
Semiconductors (SMH)– 93.87 is a monthly MA this has been above since March 2016. Slope is up so if it hits, could see some buyers there.
Transportation (IYT) – A 10% correction from the reversal top puts this at 180. 192.50 now major resistance.
Biotechnology (IBB) – 105 the biggest area of support.
Retail (XRT) – 46.91 the 50-WMA and now pivotal for the end of the week.
Twitter: @marketminute
The authors may have a position in the mentioned securities at the time of publication. Any opinions expressed herein are solely those of the author, and do not in any way represent the views or opinions of any other person or entity.

: Cup (and Maybe Handle) Watch")
 Reaches Important Price Support")

