I have had quite a few questions about my market cycle posts and cycle analysis in general over the past few days, so I thought I would get a little more in depth and attempt to address some of the questions I received.
First, let me provide a little background on myself. I have always had a tremendous curiosity for the markets, and more specifically, the technical and scientific (subjective) aspects of the markets. That said, I also understand that the fundamental aspect is very important to attaining a well-rounded understanding of securities analysis; and I have great respect for it. Yet growing up as a Generation -Y in the age of Enron, Tyco, Corzine, and Subprime, it’s also understandable why I pay little merit to mark to myth accounting and often times disregard fundamental analysis in my research. In short, I think much of it is based on inaccurate past information and “magical accounting tricks.” But I digress… let’s move on to the cycles and the basics of cycle analysis!
Cycles 101
After many years of study I have come to understand there are basically three different schools of thought of how prices move the market.
1. Technical: Fractal Pattern Repetition & Trends
2. Fundamental: Intrinsic Valuation of Earnings, Dividends, Balance Sheets, etc.
3. Cycle Analysis: statistical analysis of specific events occurring at a sufficient number of regular intervals that they can be forecasted into the future.
One other theory is: Random Walk: Modern Portfolio Theory. However, I’m pretty sure there is enough scholarly evidence to throw this school out the window by now. I have spent many wasted hours arguing at nausea with MBAs so deeply indoctrinated with this thought that I now just direct them to this paper published by three MIT Professors in 2000 that concluded “technical patterns/indicators do provide incremental information”
Why Cycle Analysis?
The trouble with technical patterns is they do have failures and they also have decreasing success rates over long periods of time. As well, Fundamental analysis is based on past information that may or may not be relevant or reliable. It is also noteworthy that major highs in the stock market are often accompanied by the best fundamentals & visa versa. Since both are reliant on “timing” as an indisputable element, it has become clear to me that to be blind of cycles is like building a house without a foundation. But, on the same hand, it is also important to understand that cycle analysis is not perfect either and the quest for the holy grain surely continues….
It was surprising to me a few years ago when I started studying cycles that the subject was covered by so few analysts. Traditional methods have mainly come from scientists and engineers whom have developed equations to analyze radio and sound signals or compound vibrations in machine equipment.
It seemed only natural that it would migrate to being used for analyzing the stock market. The main reason I really love cycle analysis is that it does not dispute any other theories of market analysis, but rather embraces all of them. And it probably is the missing link between all of them. Take for examples that many technical patterns have cycles, such as Elliot waves, and stocks clearly have “earnings cycles” and are subject to economic growth recession cycles as well.
Market Cycles In Action
Pictured above are two basic graphics highlighting the internal workings of market cycles. In short, cycles can be simplified as merely a circle of repeated events. Granted, the simplicity of the graphics above are slightly deceiving because it shows a perfect sine wave and cycles in markets are rarely “perfect.” Amongst the myriad of ways to find cycles in price data the Bartels Test is one of the most important statistical measurements I have found.
The Bartels Test looks at the “stability of the amplitude and phase of a given cycle.” Furthermore, it’s a way of isolating the most statistically significant cycles found within the data. There are other ways this process has been optimized and anyone wanting to learn more should read Lars Von Theiden Book “Decoding the Hidden Market Rhythm,” which I believe has the most advanced approach to cycle analysis.
Below is a basic Scan of relevant cycles the SPX going back to late 1999
Symbol & Series: ^GSPC Day1 / ^GSPC.close
Analysis period: 3/4/1999 12:00:00 AM -> 1/31/2013 12:00:00 AM
Bartels Limit: >= 49 % Bartels reliable up to cycle length: 700
Sorted by: Strength
Range (min-max): 5 -> 299
——————————————————————–
Length / Amplitude / Bar Cycle Low / Date Cycle Low / Strength / Bartels %
100 / 1398.49 / 40 / 4/29/1999 12:00 AM / 13.98 / 85.40 %
9 / 112.47 / 6 / 3/11/1999 12:00 AM / 12.50 / 70.87 %
84 / 948.14 / 82 / 6/29/1999 12:00 AM / 11.29 / 92.82 %
79 / 858.28 / 67 / 6/8/1999 12:00 AM / 10.86 / 79.55 %
94 / 987.34 / 64 / 6/3/1999 12:00 AM / 10.50 / 79.64 %
123 / 1289.23 / 32 / 4/19/1999 12:00 AM / 10.48 / 59.79 %
48 / 494.93 / 17 / 3/26/1999 12:00 AM / 10.31 / 80.29 %
81 / 829.36 / 4 / 3/9/1999 12:00 AM / 10.24 / 88.12 %
77 / 784.38 / 56 / 5/21/1999 12:00 AM / 10.19 / 78.32 %
I have found in my personal research that the market has a memory and that cycles relevant in today’s markets may not be relevant to 10-15 years prior. Granted, really long K Wave cycles are present but for my trading purposes I have chosen to exclude them for practicality sake.
This is where I would like to address a few questions, the first being, “Shouldn’t you adjust the cycle since the market is not perfectly in sync?”
To preserve the objectivity of this analysis, let me say that I don’t believe there are any adjustments available other than including or excluding the cycles that are found to be significant. I find this powerful because, as in any other scientific research, removing the human element is key to getting the most conclusive findings. I have plotted the cycles in the S&P 500 as they are relevant in the market below.
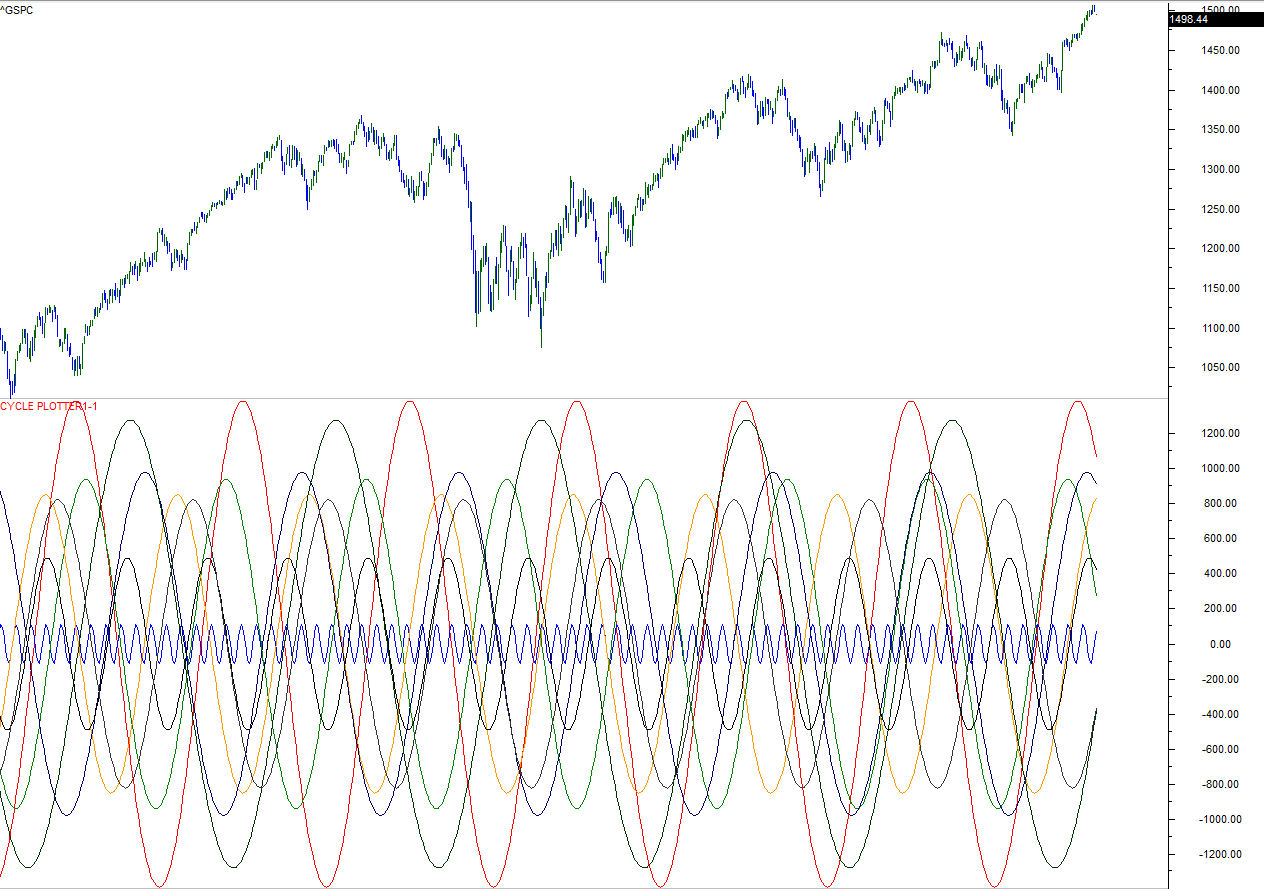
Granted at first glance this graph should spur an “OMG, what do I do with this?” moment. As you can see the raw data or individual cycles found give us little information about how the market may behave going forward. This is why additional analysis methods must be implemented with cycle analysis.
One method is called the cycle composite. This is where we can basically take all the cycles and mash them together to get one consolidated waveform and analyze how the Cycles “fit” together.
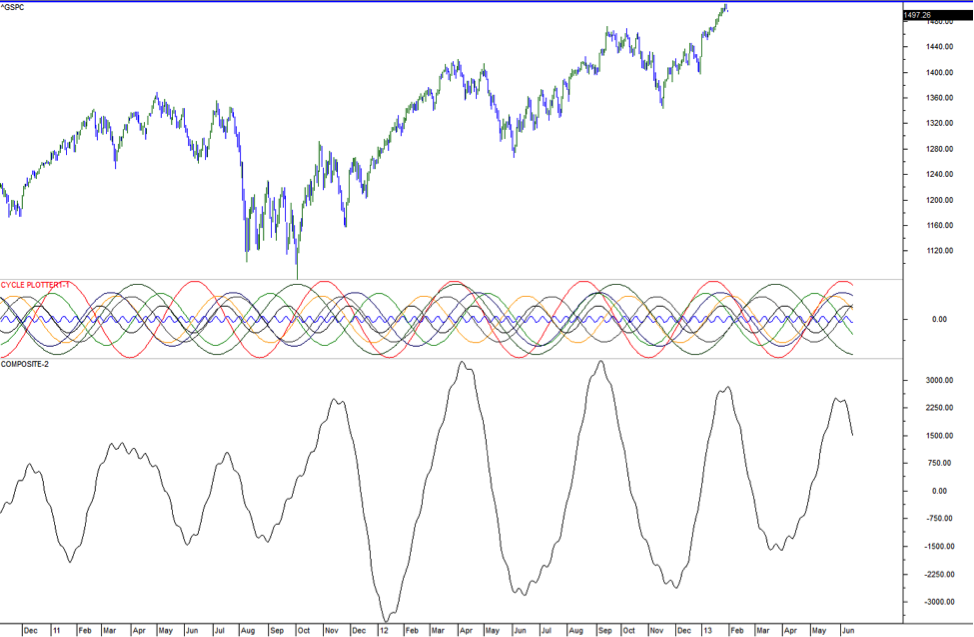
Since each cycle is seemingly pushing and pulling on the market in many different ways, their composite influence principally results from the combination of strengths and weakness of individual cycles working as a team. When they are aligned together, prices in the market rise or fall rapidly since all influences are toward higher prices or lower prices. The “fit” which makes cycles of varying lengths “cooperate” is similar to the harmonics in music. This is another reason I’m drawn to cycle analysis.
Optimization
Because with cycle analysis certain cyclical effects have been seen to have the ability to “appear” and “disappear” in the market without any explanation, this is where the art of it all comes in to play. Theories of why cycles have this phenomenon are because cycles could possibly be elliptical in nature and have a “wobble” rather than be perfect circles. These notions come mainly from areas of physics such as vortex mathematics & fluid dynamics, which explain the coriolis effect of whirlpools of water going down a drain.
So taking this notion into account I have developed a method of isolating (by backtest) only the strongest cycles that are in the market over the recent major turnings points and looking at cycles of volatility to confirm cycles in stocks. Granted, this does not guarantee the market will react to the cycles I have isolated but, like any other technical tool, this will give us a higher statistical confidence of where the market my turn.
Other noteworthy aspects of market cycles are:
- They experience vertical offsets when they are acting in opposition to each other, which may help explain how a market “consolidates” in a sideways wandering price action.
- Prices often do not terminate at the cycle extreme. There often is a “crack the whip” effect as a market moves past its cycle extreme only to be yanked in the direction of the major composite cycle(s).
- Cycles are not completely static or inflexible. They are subject to internal or external forces that can often distort their shape or cause them to lengthen or contract. The graph below is a visual layout of why and how this happens….yes we are going into 3d markets!
In conclusion, I believe that cycle analysis is a great tool for any active investor to add to their tool kit, merely because it can be applied to any type of data. Price, earnings, sales, recessions, weather, crops, etc. I have found market cycle analysis to be something that is greatly complimented with other technical and/or fundamental tools. And, finally, it offers advantages to the most important factor in trading ….. Timing! Good luck, and thank you for reading.
If you have any more questions, please feel free to reach out to me at by email at alex@aetheranalytics.com or via twitter on @InterestRateArb.
Disclaimer: This in no way constitutes investing advice. All of these opinions are my own and I am simply sharing them. I am not trying to convince anybody to do anything with their money. I am simply offering up ideas for the sake of discussion. As always, everybody is expected to do their own due diligence and to ultimately be comfortable with their own investing decisions. Any actions taken based on the views expressed in this blog are solely the responsibility of the user. In no event will Aether Analytics or its owner be liable for any decision made or action taken by you based upon the information and/or opinion provided in this blog.
Twitter: @InterestRateArb and @seeitmarket
At the time of publication the author was short March OTM call spreads in S&P 500 options.
Any opinions expressed herein are solely those of the author, and do not in any way represent the views or opinions of any other person or entity.


