Forward thinking is a great way to approach investment research. It can guide an investor to companies that may be on the precipice of explosive growth or even slightly ahead of their time.
Forward thinking often reveals little treasures. We want to share one today: CyberArk (NASDAQ:CYBR).
We believe that Cyberark is a cavern of treasure.
Some of the treasures found are not yet ready and will time to mature; however, it can pay as an investor or financial professional take time to think forward and into the future:
- How will this product, hardware, or software improve or alter us as a society?
- What could spin-off from it?
Those who follow CyberArk (CYBR) and the Technology sector likely know why it is an exciting company.
But what about its stock chart and the technicals? Well, those look pretty marvelous too in our opinion.
Uncovering gems hidden within winning sectors can become part of your future story regarding your portfolio growth. When the powerful patterns in the technicals are in harmony with strong sectors, the magic starts to happen; the alchemy begins to manifest in price and the dirt covered stone becomes a thousand points of shining light.
CyberArk is one such treasure within the “leading” Technology sector.
CyberArk Background
It solves far-reaching and grave matters in cyber defense.
- This is the only software company focused on striking down targeted cyber threats using insider privileges to attack a company’s critical enterprise assets.
- They are the only company that has solutions to help leaders from the reaction time during cyber threat. Instead, CyberArk “get’s ahead of them,” according to company info. They do this by preventing escalation of attacks before the major damage is done.
Technical Analysis
In 2016 we shared with subscribers a simple comparison chart of CyberArk $CYBR VS. the entire $HACK ETF that holds 45 technology companies. $CYBR is also a holding within $HACK, which is currently 4.78% of the ETF.
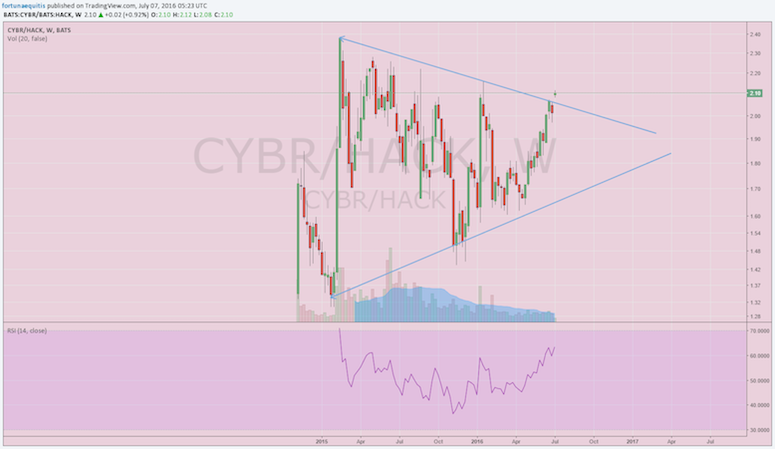
As you can see from the $CYBR vs. $HACK ETF July 2016 comparative chart, that a powerful bullish Symmetrical Triangle pattern was in play with a bullish divergence in the RSI prior to the breakout. It was outperforming the entire $HACK ETF!
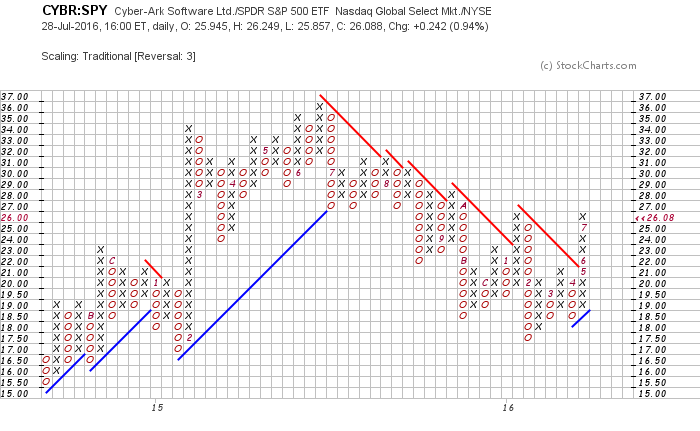
It broke out as well in the Point and Figure comparison chart with the S&P 500 ETF $SPY breaking through the bearish resistance line.
$CYBR Stock Chart | Outlook: Bullish
- Bullish Symmetrical Triangle Pattern completed the Elliot Wave pattern touches at A,B,C,D,E and broke out of the top resistance line.
- Momentum left the gate in August of 2017 and took a brief dip at E where all eyes watched for the bounce.
The price objective is high and so are the odds of more cyber-attacks. The time an advanced attack or that a Point and Figure price objective will be hit are unknowns.
In life we need more cyber less war… but in CyberArk we can all find something good for the mid to long term investor should the Technology Sector and NASDAQ continue to stay in trend.
If you are interested in learning more about our investing approach and financial services, visit us at CaptainJohnCharts.
Twitter: @CptJohnCharts & @FortunaEquitis
The author may have a position in mentioned securities at the time of publication. Any opinions expressed herein are solely those of the author, and do not in any way represent the views or opinions of any other person or entity.


