In continuing our series on the state of the major indices as we near the end of the 1st quarter, we will now take a look at the Dow Jones futures via the e-mini contract (YM). Similar to the e-mini Russell 2000 futures (TF), the opportunity to get long was several weeks ago. But that begs the question of what to do now and how to manage positions going forward? This becomes more difficult when we consider that all four major stock market indices recently tapped new highs.
After correcting in October and rebounding into year-end, investors were greeted with more stock market choppiness. The first potential opportunity that appeared to lift the market in 2015 quickly turned back down before resetting itself once again for the run higher that we saw in recent weeks.
As seen below, the overall stock market picture has lifted to all time highs but low volume persists. Can we go higher on low volume? It’s certainly possible, as markets have done this repeatedly. But we are definitely at an important crossroads. Let’s examine some key charts and the paint a picture of the current state of the e-mini Dow Jones futures (YM) and what roadblocks are ahead and what support lies below.
Dow Jones Trend Health Charts
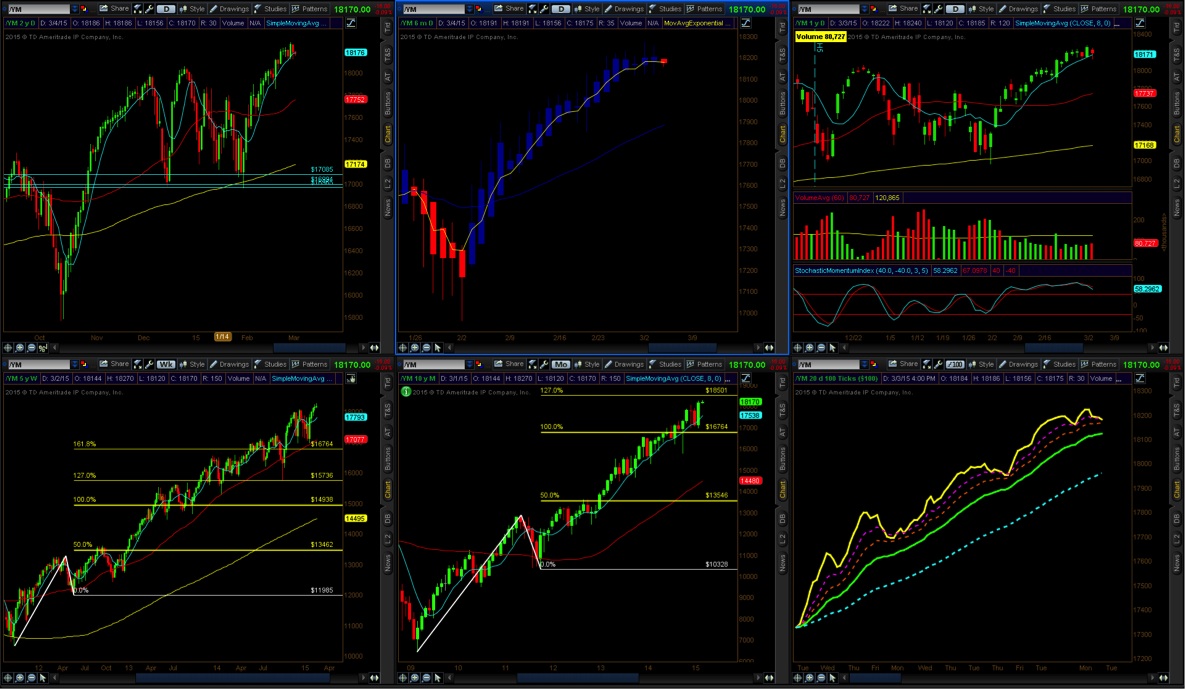
Top row (L to R): Daily chart (24hr), Daily Heikin Ashi with a 5/34 EMA, Daily Chart (US hours only)
Bottom Row (L to R): Weekly Chart, Monthly Chart, EMA (No Bars) 5, 13, 21, 34, 80
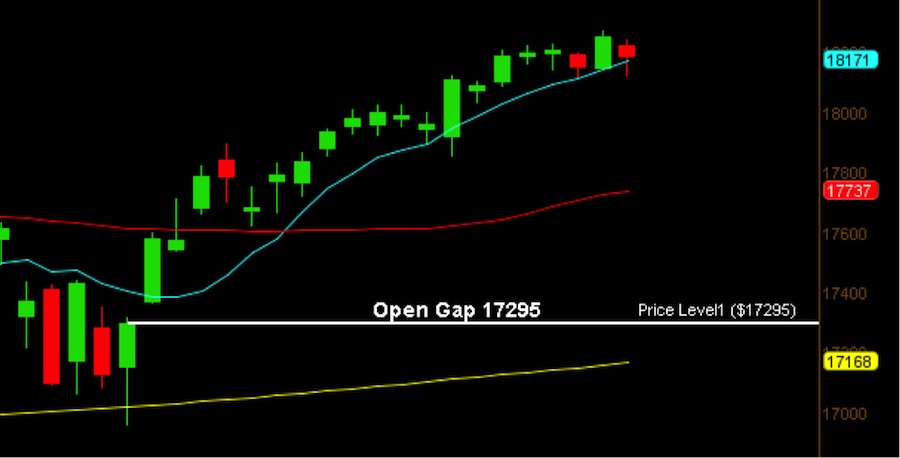
Very similar to the other three indices, price action on the Dow Jones futures contract has continued to move upside on an 8sma crossover of the 50. Note this left behind an open gap at 17295. And with no Fibonacci setup, this drive upside on very little volume leaves a bit of caution. That’s correct, open gaps eventually get closed. So where is it best to remove contracts before price action may come down. It appears by all means to be a fantastic momentum drive, but is it enough to continue higher… or are we set for a pullback?
If the YM is set for a pullback, this could be a reflection on a good number of the Dow 30 stocks to pullback.
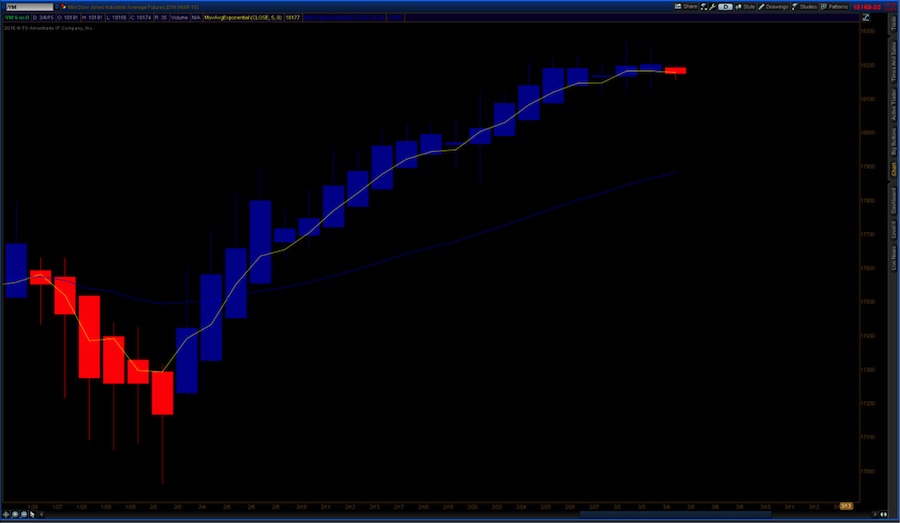
E-Mini Dow Jones Futures (YM) Daily Chart – US Trading Hours Only
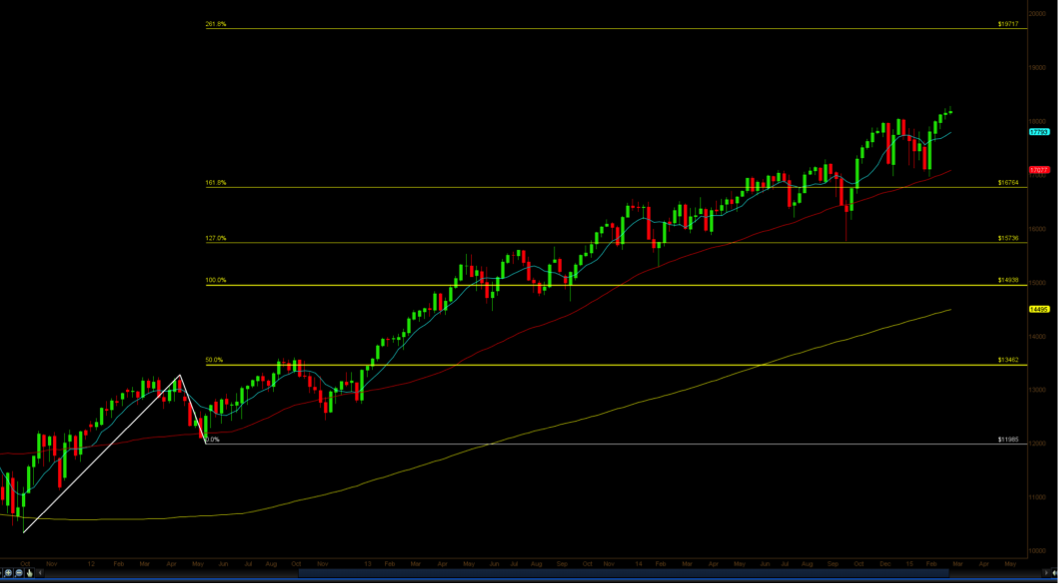
With no current setup on the daily chart for a manageable trade on a Fibonacci setup, I turn to the weekly big picture. As you can see, the YM has been relentless in its pursuit to the upside. It’s been pretty methodical in taking a pause to find support and resistance at each level before continuing to the upside. For the long-term trader/investor, that type of action is a gold mine: wait for the initial pullback and enter on the first technical candle break above the 8sma.
But that’s all hindsight now. So how does that help the current trader who either wants to get in or manage their positions on the way up? With a higher potential target on the YM at 19717, the urge to get all caught up in this bull is tantalizing. But is there enough evidence to have a clear road map higher?
E-Mini Dow Jones Futures (YM) Weekly Chart – Fibonacci Targets – 8/50/200SMA
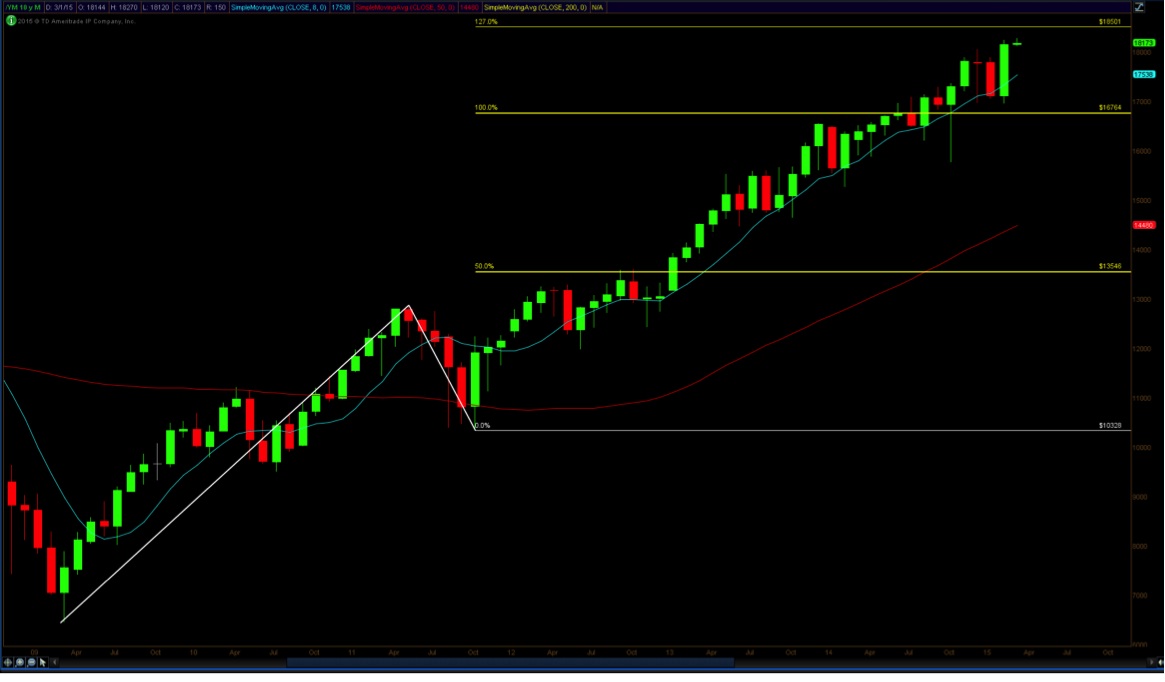
With the weekly Fibonacci target sitting much higher at 19717, our shorter-term target actually resides on the monthly chart. It currently sits at 18501 and will be a good probability yardstick for reaching the next target higher. As seen in the chart below, entry after an initial pullback and cross upside over the 8sma has been a very profitable trend trade. And considering that 18501 is the closest target, traders can use this level as an opportunity to enter (or add) to the trade once price action breaks and holds above 18501. So whether looking for the short-term target or the longer-term target, we have a road map of how we get to higher levels. So where is the optimal entry?
E-Mini Dow Jones Futures (YM) Monthly Chart – Fibonacci Targets – 8/50/200SMA
So as we have seen, the Dow Jones Industrial Average (via the e-mini – YM) is in a strong uptrend. But if you missed out on the move higher, the chart allows for re-entry on a 5/34 EMA crossover to each upside Fibonacci target.
As well, Heikin Ashi bars allow the trader to identify the trend and remain in the trade by removing emotion. It allows traders to focus their energy on managing the trade.
Daily Chart – Heikin Ashi – 5/34 EMA
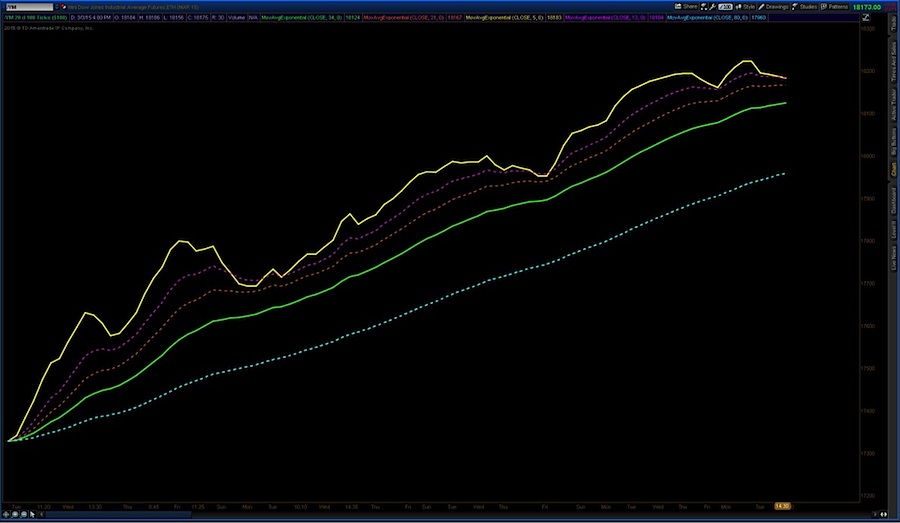
Now let’s look at the moving averages chart below. It’s notable that the 5 ema (top line) has crossed downside of the 13/21 and 34. Watch for the averages to return upside for any entry on the long side. Confirmation that the e-mini Dow Jones (YM) is continuing its uptrend comes when all the moving averages are moving higher without crossing. When this happens, and as long as HA bars are unison, then the price action will continue back upward toward 18501.
100 Tick Range Chart – 5/13/21/34/80EMA – Bars Removed
Where does this leave the intraday and long-term trader for the highest probability trade?
With the weekly chart target higher at 19717, and the shorter term monthly target at 18501, where is the optimal entry?
With the big picture trend still higher (until proven otherwise), looking for an intraday entry to the upside sets up for a higher potential of a continued move upside. What are some of those indicators to watch for? Intraday Fibonacci setup, moving averages in unison with HA bars to the upside on an initial $TICK above 250 to enter the trade. But this is for an intraday trader. A swing trader may want to hold off until a Heikin Ashi bar turnaround (solid body, tail up) after two days downside (3.3 and 3.4). That would target 18501 and allow a seasoned trader to remove half the contracts at a profit while moving the reat up to breakeven (to protect profits). Any crossover on the 5/34 EMA downside will delay the move higher. Crossover back upside will be an opportune time for entry.
I also reiterate the two facts that stand out that may prevent price action from moving higher at this point; an open gap below and low volume that has pushed up price to recent highs. We are also nearing the end of the first quarter contract, which may bring some volatility back into the market.
For more on the current state of the markets, you can read my state of the Russell 2000 post.
While I may not have the crystal ball to know what lies ahead, knowing the big picture allows me the opportunity to take intraday trades on a higher probability with the direction of the trend. Note that I personally trade on an intraday basis, in and out. So I don’t hold long term. But this same method works for swing traders as well. My next article will look at the state of the e-mini S&P 500 futures (ES). Thanks for reading.
Follow David on Twitter: @TradingFibz
The author has no positions in any of the mentioned securities at the time of publication. Any opinions expressed herein are solely those of the author, and do not in any way represent the views or opinions of any other person or entity.


