This post was written a couple weeks ago for my premium service. I think it has some interesting trading insights so I’m sharing here as well. Note that there are 2 updated trading charts at the bottom of the post.
While the Bitcoin craze means nothing to us, the chart of the cryptocurrency actually presents a potentially very attractive setup at the moment.
Recently, I was asked by Marketwatch for my opinion of the Bitcoin (CURRENCY:BTC) phenomenon and bitcoin rally. It would have been quite accurate for me to say “I literally have no opinion on it.” Figuring it would be more appropriate to at least somewhat expand on that reality, here’s what I told Marketwatch, as quoted in the article:
“Honestly, I have no idea why we need to be a part of that whole thing,” says Dana Lyons of J. Lyons Fund Management, chalking up his hesitation to Warren Buffett’s “don’t invest in what you don’t understand” philosophy.
“I know a lot of institutional backing is there with blockchain, but it seems like the entire phenomenon could vaporize at any time,” he said. “I’m probably wrong, but without having an identifiable edge, I strain to find any reason to allocate capital (especially clients’) to the space.”
That basically sums up our feelings toward the whole cryptocurrency phenomenon. The most crucial point is that not having any kind of an edge in the space would make any investment or trade a veritable gamble.
Now, in a bit of a throw away sentence in my email to Marketwatch, I mentioned that “sure, we could chart the thing but there are literally thousands of securities with decades of patterned price history that make much more sense in that respect.” And that was the flat-out truth, as far as I was concerned.
Then I actually looked at the Bitcoin chart…
One glance at the chart — which I never really intended to do — had me at least considering taking a deeper look at the price structure. What immediately caught my eye was a potential buy setup in the near-term. In fact, ironically, I doubt there are many charts among those “literally thousands of securities” that offer a better potential setup at the present time.
Before I get into the partial change of heart, let me reiterate one thing regarding Bitcoin. We have ZERO edge regarding our understanding of the phenomenon and its future potential. As such, we have no intention of trading it within our client accounts in the foreseeable future. Finally, given the (relatively) tenuous structure and regulation surrounding cryptocurrencies in general, any trade in the space must be considered pure speculation and nothing more.
Alright, with that said…here are 3 reasons that I really like the potential of the chart at the moment.
1) Reliable conformity to charting analysis
When considering any price plot, especially one as immature and enigmatic as bitcoin, it is imperative to first study the chart history to determine whether prices actually appear to adhere to traditional technical analysis or charting techniques. If that is not the case, then it is utterly pointless to attempt to chart the issue as the lack of traditional guideposts will have you driving blindly.
In this case, though BTC is still relatively young, its price movement (especially in the most recent few cycles) does seem to conform to much of the charting analysis that we like to employ, e.g., Fibonacci especially. Check out the “long-term” chart:
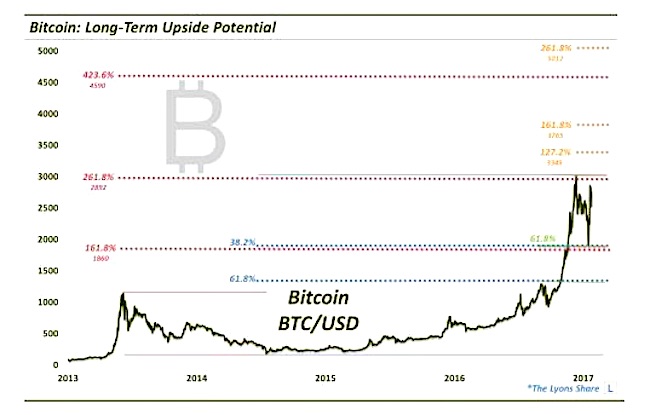
We left the y-axis elongated as it is in order to show potentially relevant levels above Bitcoin’s highs to date. But before we get ahead of ourselves, take a look at how closely BTC has conformed to key Fibonacci lines, including:
- The 161.8% Fibonacci Extension (in red) of the 2013-2015 decline lies near the 1860 level. This was in the vicinity of both the initial interim high this spring following a breakout above the 2013 and early 2017 highs, as well as the low set in the recent mid-July pullback.
- The 261.8% Fibonacci Extension (red) of the 2013-2015 decline lies near the 2892 level, or right near the all-time highs set in June.
- The 61.8% Fibonacci Retracement (blue) of the 2015-2017 rally lies near the 1250 level, i.e., the level of the breakout above the 2013 and early 2017 highs.
- The 38.2% Fibonacci Retracement (blue) of the 2015-2017 rally lies near the 1928 level, in the vicinity of low set the recent mid-July pullback.
- The 61.8% Fibonacci Retracement (green) of the rally from the 2013-2017 breakout level to the June highs lies near the 1900 level, in the vicinity of low set the recent mid-July pullback.
I think that is enough evidence to confidently proceed with an earnest analysis of the Bitcoin chart.
2) Substantially optimistic prospects for higher prices (if looking to buy)
This box gets checked as well as the chart-based outlook for BTC in the near, and longer-term, appears bright. The main point is that the recent June-July consolidation looks to us like a continuation pattern, i.e., prices should eventually resolve higher in continuation of the rally initiated by April’s breakout above the 2013-2017 highs.
Following the most recent selloff in July, BTC importantly rallied back up to near the June highs. This suggests that the post-June decline was perhaps a counter-trend ABC down wave that has been completed via the recent bounce to higher interim highs. Thus, based upon that analysis, new highs should be in the cards for BTC.
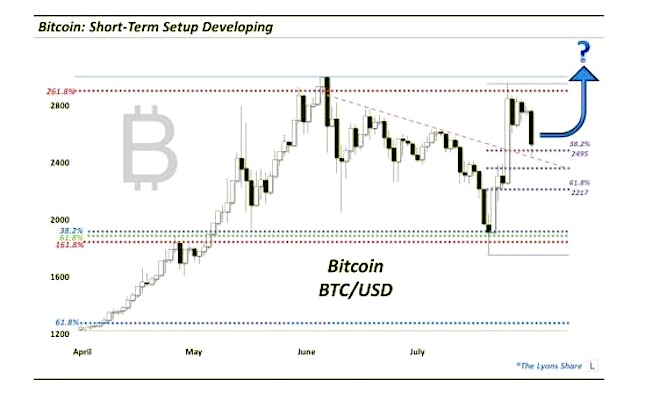
3) An identifiable and nearby trigger (e.g., price point)
This last requirement is satisfied as well as, in our opinion, the pullback over the past few days has put BTC into position here it can commence a new up-leg at any moment. Any of the purple Fibonacci Retracement levels would suffice in containing the recent decline and in serving as a springboard to a new rally. Thus, anywhere between the 38.2% Retracement ~2498 and the 61.8% Retracement ~2222 should be a solid entry point on the long side in Bitcoin. A decisive close below 2222 would undermine our bullish analysis and suggest stopping out one’s position.
If our scenario is valid, how high can Bitcoin go? While we don’t like to apply targets to our trading, using Fibonacci Extensions of this recent June-July consolidation may be reasonable to set expectations for a post-breakout move. BTC’s conformity to the 2013-2015 Extensions provide cover for our use of these new Extensions. Here are some possibilities based on said Extensions:
- 127.2% Fibonacci Extension of June-July decline = ~3340 (+33% from current levels)
- 161.8% Fibonacci Extension of June-July decline = ~3772 (+50% from current levels) *Best Bet?*
- 423.6% Fibonacci Extension of June-July decline = ~4592 (+84% from current levels)
- 261.8% Fibonacci Extension of June-July decline = ~5012 (+100% from current levels)
Obviously, there are a lot of big IF’s that we are dealing with here for the above gains to materialize. However, based upon our read of the BTC chart, as we would apply to all other charts, the possibility of hitting at least the 1st 2 “target” levels is good enough from a risk/reward standpoint to warrant an entry here.
Again, we are not telling anyone to buy Bitcoin. It is doubtless more risky and unstable than most securities that we cover every day. That said, if one is so inclined to partake in the speculation, our read of BTC’s current chart setup is about as favorable as it gets.
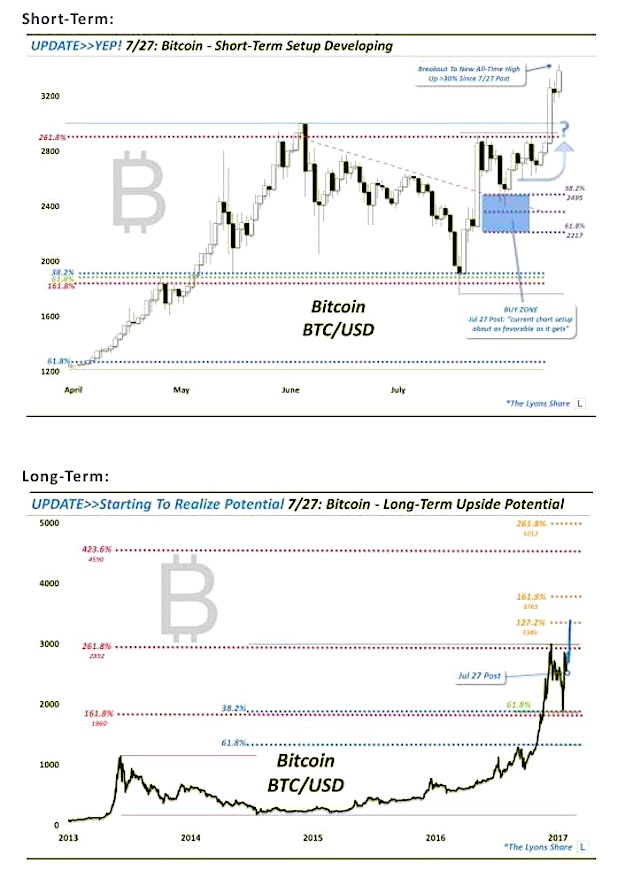
Updated Trading Charts!
Bitcoin has seen a strong reaction higher off the levels highlighted in our post.
If you want this “all-access” version of our charts and research, I invite you to check out my new site, The Lyons Share. Thanks for reading!
Twitter: @JLyonsFundMgmt
The author does not have a position in mentioned securities at the time of publication. Any opinions expressed herein are solely those of the author, and do not in any way represent the views or opinions of any other person or entity.

: Showing Some Signs of Emerging Strength")
