Crude Oil (USO) Offers Big Potential Return Over Short-Term for Bullish Traders
Crude oil has had a crazy ride since late 2015, when it dropped around 45% before regaining all of that loss in the first 6 months of 2016.
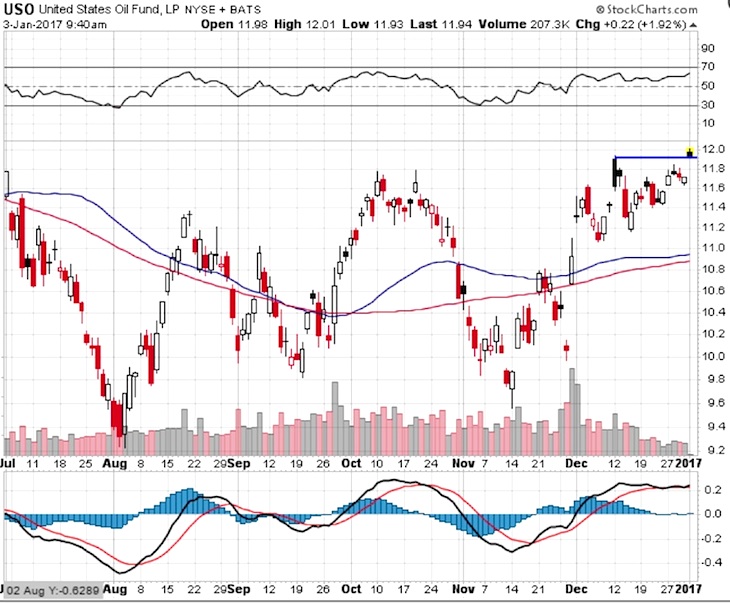
In the back half of 2016, crude chopped around a bit and is now threatening a breakout.
One of my favorite technicians, Mark Arbeter, recently wrote here on See It Market that “Crude oil is trying to break meaningfully above chart resistance and the neckline of a large inverse head-and-shoulders pattern in the $52.20 area. As long as price remains above the neckline, crude is in decent shape.”
However, he also noted that “there is a pretty good pattern of crude oil cycle lows every 6 months. And, as well, there is a pattern of seeing cycle lows early in the year.”
Traders willing to bet that crude will hold above the current breakout level can trade this with options via a Bull Put Spread using the ETF USO.
Bullish traders could use the $12 strike as the short put and the $11.50 strike as the long put.
With USO trading right around $12, this trade offers a roughly 51% return on risk over the next 17 calendar days when using the January 20th expiry.
The maximum profit on the trade would be $17 per contract with a maximum risk of $33. The spread would achieve the maximum 51% profit if USO closes above $12 on January 20th in which case the entire spread would expire worthless allowing the premium seller to keep the $17 option premium.
The maximum loss would occur if USO closes below $11.50 on January 20th which would see the premium seller lose $33 on the trade.
The breakeven point for the Bull Put Spread is $11.83 which is calculated as $12 less the $0.17 option premium per contract. Keep in mind that due to the bid-ask spread, you may not be able to get filled at these prices.
Looking at the chart, USO today out above the prior high. That’s a bullish sign.
USO is currently above both the 50 and 200 day moving averages. The 50 day moving average is above the 200 day moving average which is considered a bullish sign. Both the 50 day and 200 day averages are sloping higher, which is another bullish sign.
Learn more about options trading in my FREE 4 x 1 hour live webinar series starting January 10th. Register for 10x Your Options Trading: The Powerful Techniques to Reduce Your Learning Curve and Earn More Today.
Thanks for reading.
Twitter: @OptiontradinIQ
The author has a position in CS at the time of publication. Any opinions expressed herein are solely those of the author, and do not in any way represent the views or opinions of any other person or entity.


: Showing Some Signs of Emerging Strength")
