Oil prices surged on news of the Russian invasion, as investors knew the energy sector would be greatly effected by the war.
But for how long?
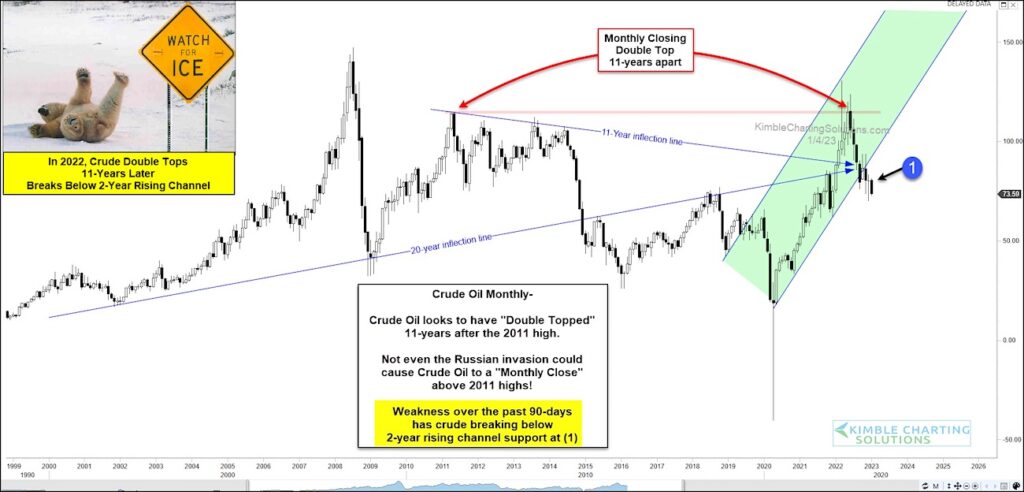
Looking at the “monthly” chart below of crude oil it appears “not for that long”.
Note that we highlighted crude oil’s bearish price reversal back in November.
As you can see, crude oil prices rallied and reached up above its price 11-years prior before reversing sharply lower. This double top was also confirmed by crude oil’s inability to close above the monthly closing high price 11 years prior.
To make matters worse for crude oil bulls, price is now breaking below its 2-year rising trend support line at (1). This breakdown is also important because (1) also marks the convergence of 11 and 20 year inflection trend lines. Yikes! All the more reason to stay tuned!
Crude Oil “monthly” Chart
Note that KimbleCharting is offering a 2 week Free trial to See It Market readers. Just send me an email to services@kimblechartingsolutions.com for details to get set up.
Twitter: @KimbleCharting
Any opinions expressed herein are solely those of the author, and do not in any way represent the views or opinions of any other person or entity.

: Worrisome to Broader Market?")

