Note that this article was sent to clients of LaDucTrading on April 11th.
Oil Market Thoughts
WTI crude prices soared 25% on April 2nd for its largest single-day percentage gain in history after President Trump said he expects Russia and Saudi Arabia to announce a major output cut deal.
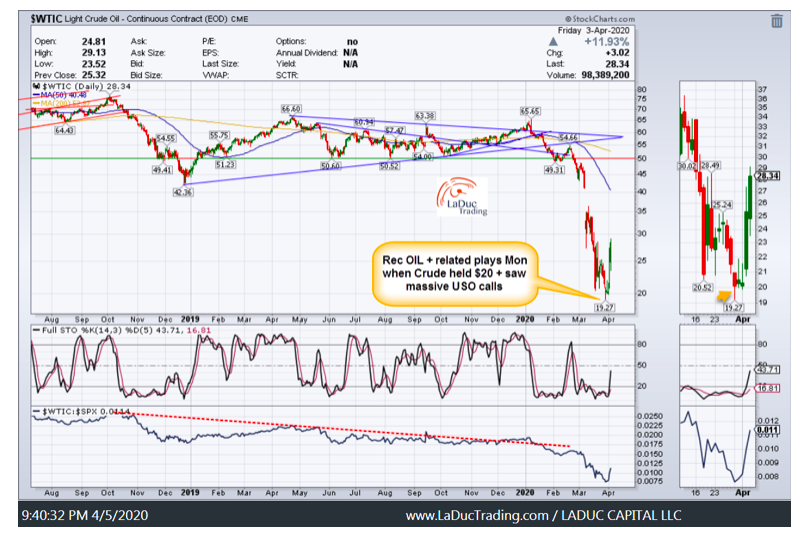
So we caught that Oil spike, but now what…
The world is waiting on WORLDPEC to announce an Oil cut to help normalize oil supply in a time of CoronaVirus demand destruction. Even if all agree, it will likely take a protracted time to re-balance the oil markets. The oil market remains in significant over-supply with potential demand drops of 10-20M bbl/d over the March-June period as COVID19 lockdowns destroy demand for petroleum products. This will and has led to significant inventory builds which has and will continue to overwhelm oil storage facilities and tankers.
Trump has threatened both Russia and Saudi Arabia to cut production (of an unrealistic 40%) or face retaliation including possible tariffs and other sanctions. The US has no plans to join a production deal, even if it could given Anti-trust laws that govern the 1000+ smaller US producers.
Even if Russia and Saudis have agreed to oil cuts with OPEC+, will U.S. producers voluntarily cut production 30%-35% to offset plunging oil demand from COVID19 (and dwindling storage options)? Exec Chairman Harold Hamm of CLR, and advisor to Trump, told S&P Global Platts they would. Color me skeptical. I believe, as I stated Friday in my live trading room and leading up to the OPEC++ Friday meeting, that the path of least resistance is actually down short term until the speculators puke – Closer to $17, as I have been calling for about a month. Then Trump can come in and save shale – but not likely before.I’m not alone in my oil call; My favorite oil trader tweeted this weekend:TI at $17/bbl ought to help them get to where they need to be, snatching defeat from the jaws of victoryThen in DM he wrote: “specs are long up the gazoo”, which is very different from two weeks ago when hedge funds were largely short….
Industry In Crisis
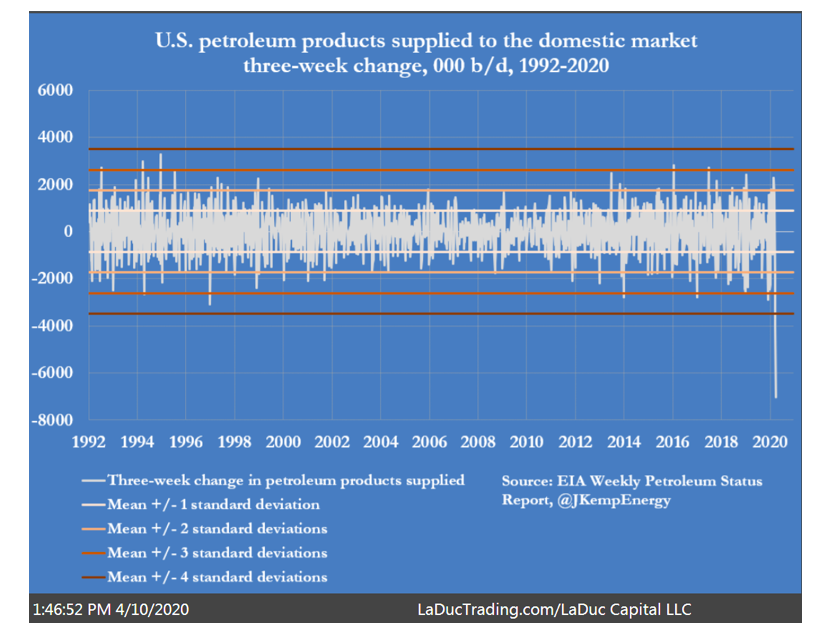
As John Kemp recently wrote in his Reuters article, we can get some idea of the extraordinary speed and scale of the disruptions in the oil market by seeing the “Weekly Petroleum Status Report” published by the U.S. Energy Information Administration on Wednesday.
The latest weekly report reveals an industry in crisis – unable to cope with the simultaneous collapse in fuel consumption and rise in crude production. – John Kemp, Reuters
Petroleum products fell 7M bbl/day over last 3 wks, which is more than an 8X standard deviation move. The EIA on Wednesday reported a 15.18 million barrel rise in crude stockpiles, the largest weekly build in data going back to 1982.
The abrupt collapse in consumption has no parallel in history, not even the depression years of the 1930s.
It went from bad to an outright disaster earlier this week when Goldman, Vitol, and the IEA all raised their estimate for daily oil oversupply to an unthinkable 20 million barrels per day, as a result of the collapse in oil demand as the global economy grinds to a halt coupled with Saudi Arabia’s determination to put all of its higher-cost OPEC peers out of business. This means that for the oil market to rebalance, both Saudi Arabia and Russia would have to halt all output. Needless to say that is not happening, in fact Saudi Arabia is now pumping between 2 and 3 million barrels more than it did last month. Crude is overwhelming storage capacity. – Zerohedge
With the oil market falling into a so-called super contango, which means it is now profitable for traders to buy oil today, store it, and reap the profits by selling it at a higher price months or even years down the line, traders are scrambling to dump oil in portable storage.
Translation: All of a sudden, there is no demand for roughly 20% of global output – every single day. This is a once-in-a-generation type of event.
Path of Least Resistance
On Thursday, OPEC+ pledged to cut crude production by 10 million barrels per day starting in May as part of a global effort to balance the market. The reaction in crude was telling. It peaked on the day at $28.36 on chatter about a 20 mbpd cut then fell to $23.19 to close near the lows of the day.
the market remains easily oversupplied by 20 mbpd and more-likely 30 mbpd, so it will fall on the private market to do the rest – voluntarily or otherwise. There is no clearing price for crude once storage is full and there was a report Thursday of 25 oil tankers floating offshore in Europe. They had been expected to deliver crude but were asked to wait because refineries don’t have anywhere to put it. – Ashraflaidi
So OPEC and Russia cut by 22% and wait for rest of world and US to do the same?
But what if no one else agrees…
“Crude would be in the teens now if Cushing was full, only catching a bid cuz of storage, trading higher than Houston, specs haven’t puked yet, if that were to happen could think more constructively about a sustained rally” – @RobertMacMinn
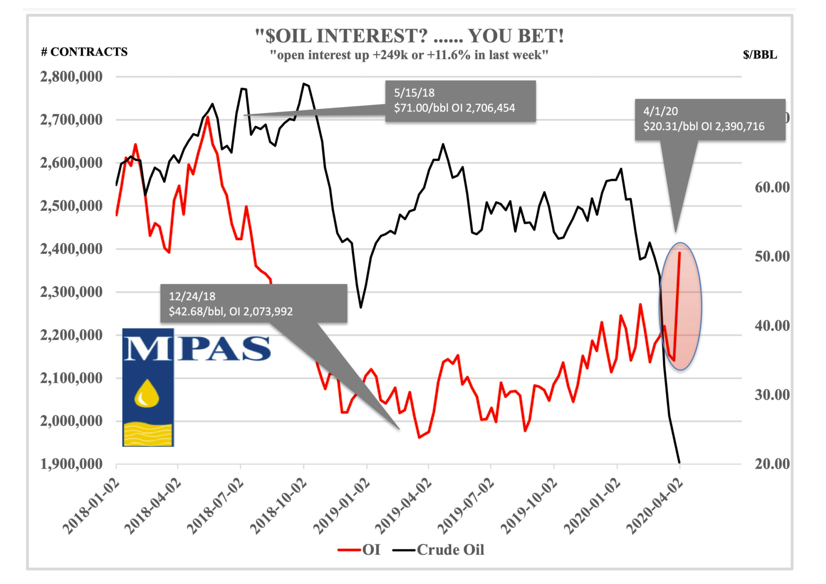
Before the last Oil spike in price, I wrote about how the ratio of bullish long positions to bearish short ones had fallen close to its lowest at any time for the last six years. Such lopsided positioning has usually preceded a sharp reversal in prices, and it did. Brent prices surged more than $11 per barrel (50%) and that’s why I recommended long.
But now? “Specs are long up the gazoo.”
Crude looks shortable into ~$17. Then let’s see.
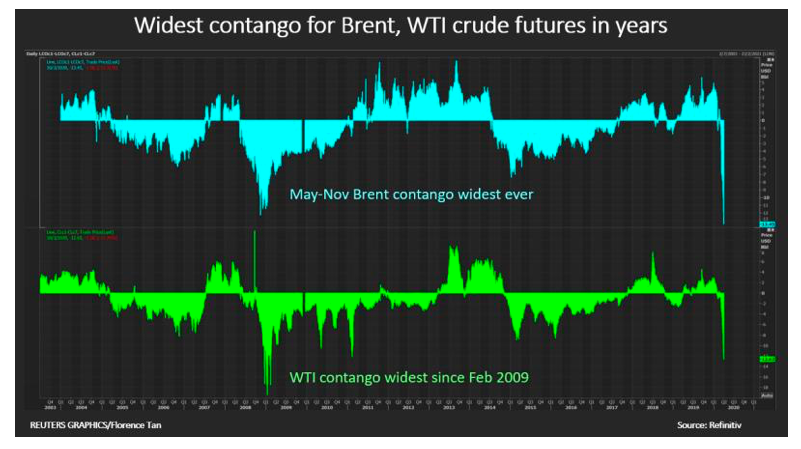
Super Contango
Blame coronavirus… demand has dropped by as much as 30M barrels per day (roughly equivalent to the combined output of the Saudis, Russia and the U.S.).
The rapid accumulation of crude and fuel stocks along the supply chain threatens to overwhelm available storage capacity and bring production to a halt through a combination of ultra-low prices and capacity constraints. Only once price falls to wash out speculators and threaten insolvency in oil producers, can we get to a sustainable bottom for a trend-reversing turn higher. And only after we move through and out of contango.
With the oil market falling into a so-called super contango, which means it is now profitable for traders to buy oil today, store it, and reap the profits by selling it at a higher price months or even years down the line, traders are scrambling to dump oil in portable storage. Firms including Vitol Group and Gunvor Group, two of the world’s largest oil traders, say there’s intense demand to keep barrels at sea. – Zerohedge
Knock-on effects from Oil Contango is good for gold.
Today’s super volatility in oil results from its super negative carry (contango). Both phenomena reflect oil’s escalating physical oversupply. However, there is also a macroeconomic equivalent: contangos foreshadow disinflationary momentum i.e. extreme contangos indicate extreme disinflation (see ’08 crisis). Do negative carries have natural limits? Yes. In theory, oil’s maximum forward premium equalizes maximum oversupply (peak deflation). In the extreme, a possible oil spot price of zero $ produces “final-contango” & the implosion of the market itself. In practice, though, oil production ceases, kickstarting demand long before the “zero-price” event materializes. Oil’s quest to avoid “final-contango”, however, results in the simultaneous emergence of a broader macro-carry vortex. As the economy’s supply shock intensifies, numerous carries are sucked towards deflation’s ground zero: equity dividend futures collapse, the yield of ultra long-term debt hits 0%… Gold, in contrast, thrives on this vortex. As interest rates turn negative, the traditional non-yielding metal mutates into a yielding one. Eventually, oil’s ultimate contango delivers gold’s maximum positive carry. – OilandGas360.
With that, previous Oil price contango extremes have marked major bottoms.
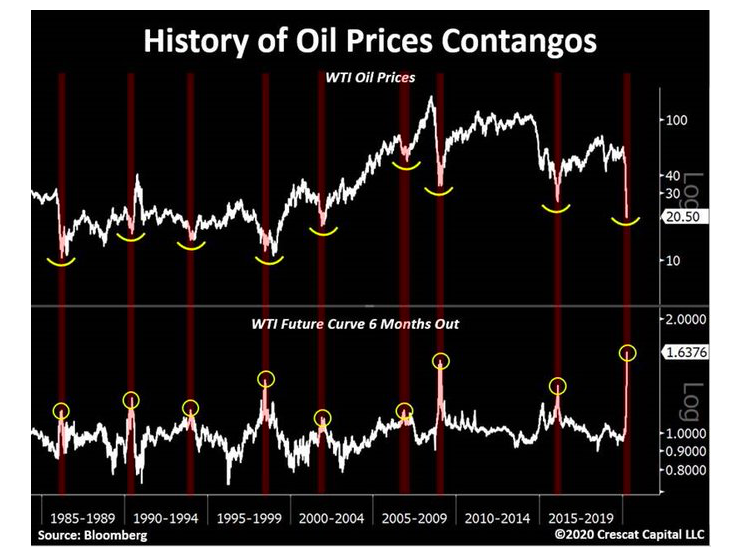
Oil’s 12M Contango on April 1st was -43%, the 3rd worst day in the 40-year history of traded futures. Only *two days* in history were more extreme: 3/31-4/1/1986. – @MacroCharts
*Normally*, I would say this looks like a fabulous time for Oil to base – similar to 1986/2008 – “setting up a big potential recovery trade on the other side”, but these are far from normal times. Just because I saw a trade worthy bounce last two weeks, doesn’t mean I don’t see a bearish oil price backdrop down into $17 area. My point: pace yourself. This could be a little while to base.
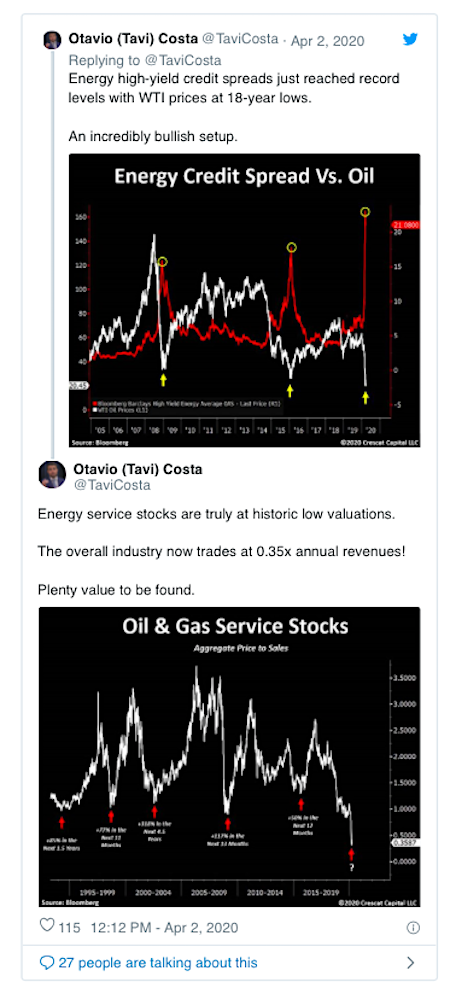
And then there is that Fed-protected High Yield/Junk Bond market full of oil and gas producers… this should help the space find a bottom.
With that, we are getting a bottom fleshed out. And I do not *KNOW* the bottom price, yet. My chart read says ~$17 but Morgan Stanley suspects we could briefly touch $10!!
MS lowered 2Q / 3Q Brent forecasts by -$10 to $20 and $25/bbl, respectively. Also lowered 4Q by -$5 to $30/bbl, with ’21 unch’d at $42.50.
Estimates global storage capacity will be exhausted by late 2Q / early 3Q at current supply / demand trends (now forecasting ’20 demand falling -5mm bpd YoY to 94.9mm bpd). Oil prices will need to decline enough to force shut-ins of already producing fields once storage has been exhausted. However, only ~7mm bpd of global oil supply has short-run marginal cost of >$10/bbl… which means oil prices may need to briefly fall close to that level.
I hope we don’t ever see $10. The world at $10 oil is not investable.
Samantha LaDuc is the Founder of LaDucTrading.com and the CIO at LaDuc Capital LLC.
Start with FreeBait! Then take the next step: Come Fish With Me.
Twitter: @SamanthaLaDuc @LaDucTrading
Any opinions expressed herein are solely those of the author, and do not in any way represent the views or opinions of any other person or entity.

: Worrisome to Broader Market?")


