 Ever tried to explain the jagged, awkward and idiorrhythmic correlation (and causal links) between oil and gasoline prices to someone complaining about prices at the pump? Don’t make the mistake of trying to sort this out to a wine-numbed inquisitor at a dinner party. Even without looping in such concepts as contango, it’s bound to be a messy business.
Fortunately, in this case a picture really is worth a thousand words: a continuous price chart comparing oil and gas dispenses with explanation and deftly recaps these mentally cumbersome relationships, whether obvious or esoteric.
As an example, check out the chart below comparing Light Sweet Crude Oil (Symbol: CL) and Gasoline (Symbol: RB) futures. Over the last three weeks oil has moved steadily higher, up 12.4% in the last 3 weeks alone. By comparison, gasoline futures have generally kept pace, advancing 10.8% off their lows at the beginning of that period. Oil’s move is culminating in a symmetrical triangle breakout over 103.50/bbl that is 3 years in the making.
Light Sweet Crude Oil Futures – Weekly (click image to zoom):
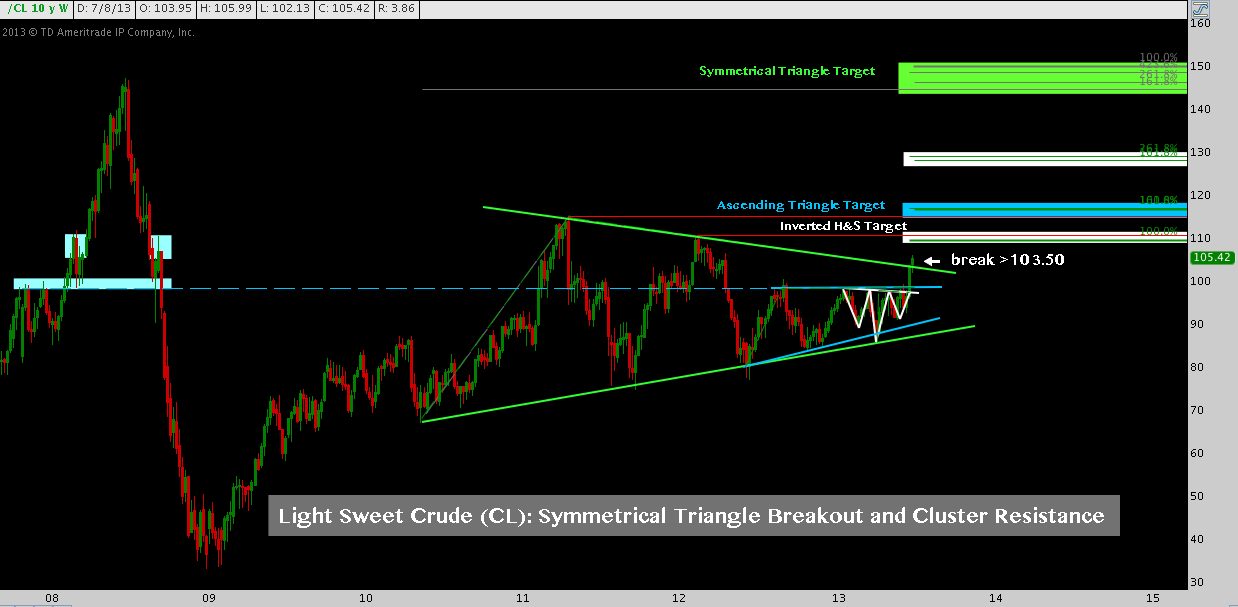
Triangles are notoriously fickle patterns. Sometimes enormous in their implications (this one projects a 50% move higher in oil!), they’re fraught with peril: as a function of the diagonal support and resistance that frame them, the lower highs inherent to their topside construction (likewise with the higher lows) present multiple obstacles to a sustained post-breakout move higher.
But, before paralyzing the pattern’s potential with what ifs, let’s set what could happen to one side and focus on what has happened: simply put, the crude oil breakout from this pattern targets all-time highs near $150.
Where’s gasoline in all of this? Gas futures have cycled through a lengthy post-’08-’09 consolidation just like oil; and have caught the same bid enjoyed by oil the last few weeks. But: gasoline has not broken out.
In fact, gasoline’s construction is lagging oil by a considerable margin. Not surprisingly, the longer-term tight positive correlation (bottom panel; here defined as 50 weeks or “yearly”) that characterizes Light Sweet and Gasoline as a rule has broken down to levels not seen in years.
Light Sweet Crude Oil v. Gasoline – Weekly (click image to zoom):
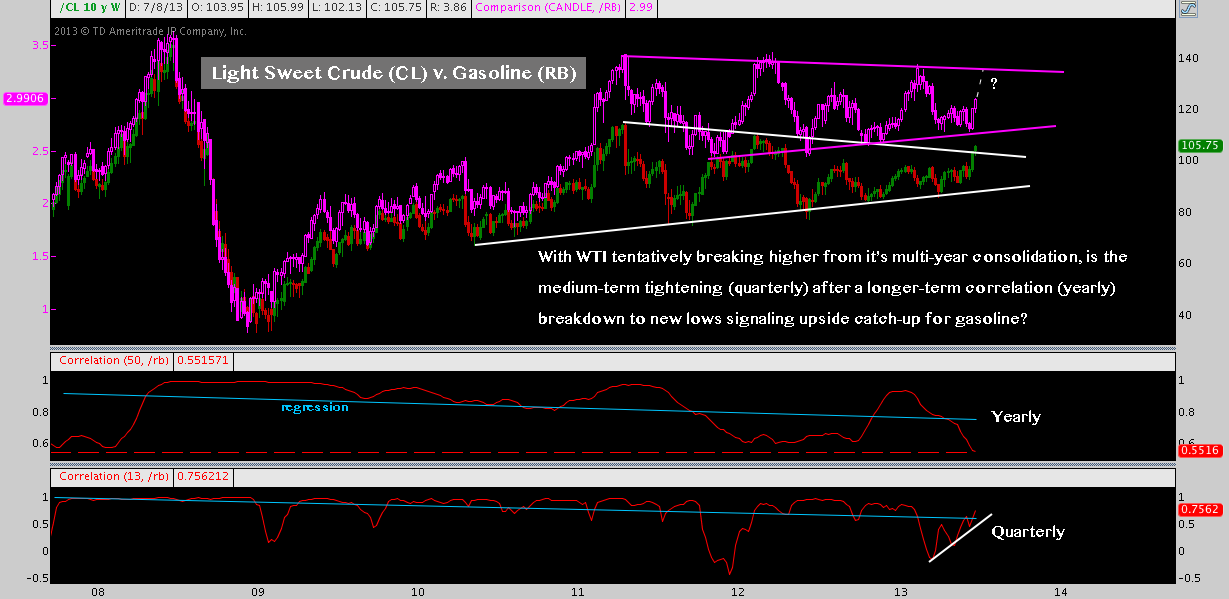
Importantly however, gasoline’s medium-term correlation (bottom panel; here defined as 13 weeks or “quarterly”) has dipped and reverted toward it’s regression line near 0.7.
This begs the following question:
Assuming the crude oil breakout at 103.50 holds and higher prices are the offing: does the return to a high medium-term positive correlation imply a tighter longer-term reversion higher, higher oil prices and a comparative out-performance in gasoline as it moves to catch up?
If so, RB has room to move considerably higher: on the level of 10%+ to its own symmetrical triangle resistance trend line; and this is prior to any consideration of a post-breakout move.
Without question, oil has shown indisputable relative strength v. gasoline in 2013 – but keep in mind this relationship can (and does) change; oil does not always lead, and when it does it isn’t often in an intuitive fashion. Also as I alluded to: this symmetrical triangle crude oil breakout may fail – in fact, a bull trap/breakout failure on a pattern this large can result in devastating consequences in a more adverse scenario (e.g. triangle to downside target near $60). In other words, keep an eye on CL around $103.50 – any dip below here may signal trouble for higher oil. Back into oil’s triangle and below triangle support at $90 would have heavily bearish ramifications (even if the average consumer would see things quite differently!).
There you have it: and now for brighter minds to extrapolate how painful this could become at the pump.
Twitter: @andrewunknown and @seeitmarket
Author holds no position in any securities mentioned at the time of publication.
Any opinions expressed herein are solely those of the author, and do not in any way represent the views or opinions of any other person or entity.

: Showing Some Signs of Emerging Strength")
