Our analysis suggested shorting crude oil futures in July 2014 with a break of $101.95 and our model remained short for 6 quarters. On January 20, 2016 (9:43 am) we notified our followers about a potential bottom in oil prices on Twitter:
“Using multiple methods, ~$22 seems to be the price at which the down-trade would be ‘perfected’. Prudent risk management, given target/trailing stop, suggests covering in front of $26.50.”
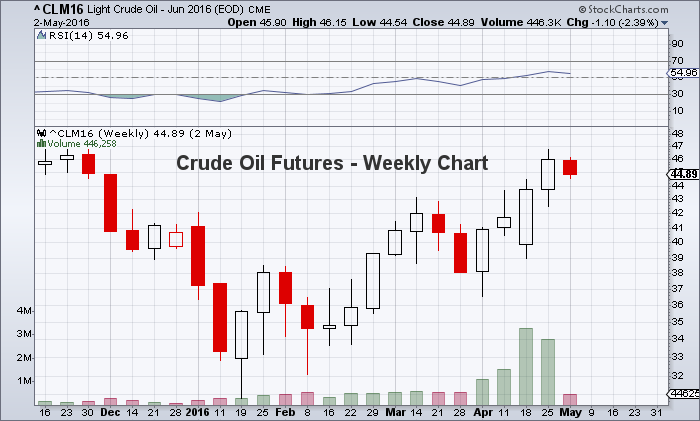
The low and low-settlement of the down-trade that began in July 2014 was achieved on that very day; subsequently, the price of crude oil has increased ~62%.
In the remainder of this article, we will explain how to interpret our analytical output and what it suggests for crude oil prices going forward. Please reference the analysis for May 2 below while reading (or visit our website).
May 2, 2016 analysis reference sheet – Crude Oil Futures
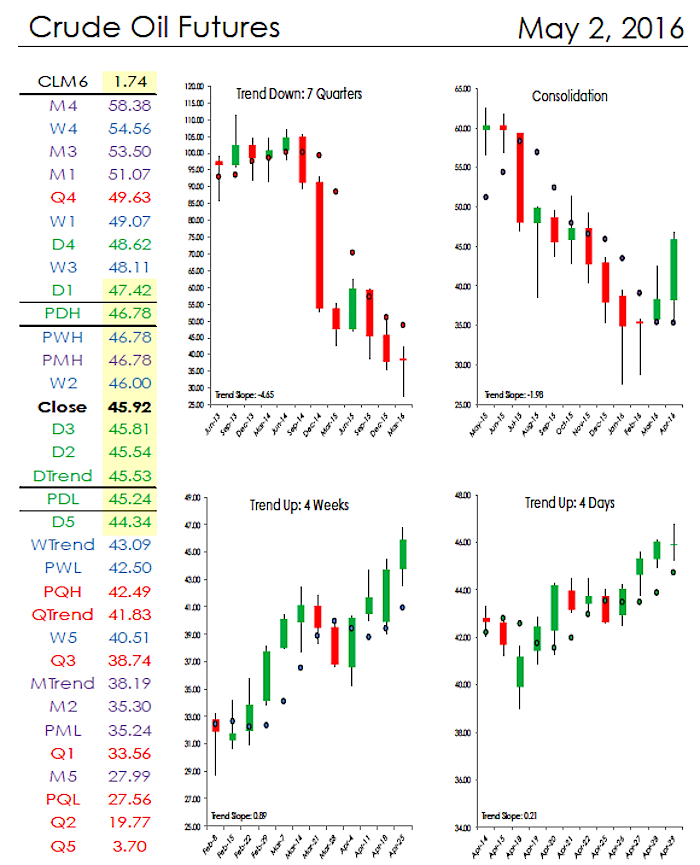
Time-Periods
Always work down in time-period; Quarterly, Monthly, Weekly, Daily. The longer the time-period, the more significant the level. The levels are color coordinated: Red = Quarterly, Purple = Monthly, Blue = Weekly, Green = Daily.
Trends
We calculate trends mathematically and what they represent is the price at which supply and demand are in balance. Quarterly Trend is static for the current quarter. Monthly Trend is static for the current month. Weekly Trend is static for the current week. Daily Trend changes each day. The first thing you should be aware of is where the market (crude oil prices) is relative to the trends:
Current Settle = $45.92
Quarterly trend = $41.83 Market > Qtrend = Bullish
Monthly Trend = $38.19 Market > MTrend = Bullish
Weekly Trend = $43.09 Market > WTrend = Bullish
Daily Trend = $45.53 Market > DTrend = Bullish
The second thing you should be aware of is where the trends are relative to each other; similar to a moving average cross. This tells you the strength of the trend.
DTrend > WTrend = Bullish (in the daily time-period)
WTrend > MTrend = Bullish (in the weekly time-period)
MTrend < QTrend = Bearish (in the monthly time period)
Collectively, the uptrend is strong for oil prices, and when MTrend moves above QTrend it will be at its strongest. IE, bullish in all time-periods.
The third thing you should be aware of is the slope of the trend for oil prices (or any asset you’re evaluating. If the trend has positive slope, that is a sign of strength. If the trend has negative slope, that is a sign of weakness. Relatively little slope is a sign of congestion; the market is building energy for the next move. Why fight a trend that, itself, has taken on slope? You shouldn’t.
For CLM6, the slopes are (noted in the graphs):
QTrend, -$4.65 per quarter (over the previous 12 quarters)
MTrend, -$1.98 per month (over the previous 12 months)
WTrend, +$0.89 per week (over the previous 12 weeks)
DTrend, +$0.21 per day (over the previous 12 days)
We define markets as ‘Trend Up’ if there have been >=3 consecutive settlements above the trend, ‘Trend Down’ if >=3 consecutive settlements below trend. Otherwise, markets are in ‘Consolidation’.
Basically, we use a trend-following system on my site Global Technical Analysis for each time-period focus. For example, if your time-period focus is weekly, your most recent trade on crude oil would have been covering shorts and reversing long the week of April 4, 2016 (bottom left graph). Assuming you took the trade when the market settles > weekly trend, you have been long for 4 weeks with a cost basis of $40.23. Your stop/reversal level is a weekly close < weekly trend; currently $43.09.
Support/Resistance
These price levels are calculated mathematically. There are 5 levels calculated for each time-period: labeled as 1,2,3,4,5. Just as with trend levels; quarterly levels are static for current quarter, monthly levels are static for current month, weekly levels are static for current week, and daily levels change each day.
Additionally, we include the previous period high and low. The reason for the previous period high and low being included: the purpose of each trading session is to take out the high or low of the previous session.
On March 31, 2016, we calculated the quarterly levels for 2Q2016 for crude oil prices (futures)… along with previous quarter high, previous quarter low, and settlement price:
Q4 = $49.63
PQH = $42.49
Q3 = $38.74
Close = $38.34 (03/31/2016)
Q1 = $33.56
PQL = $27.56
Q2 = $19.77
Q5 = $3.70
In isolation, you interpret this information in the following way. Once the market (here crude oil) breaks above 1st resistance at $38.74, it faces resistance at PQH level of $42.49. Clear that level and the exhaustion target is $49.63. 1st support is $33.56, clear that and weakness should accelerate down to PQL level of $27.56. Once PQL is cleared to the downside, there is no support until $19.77 with an exhaustion target of $3.70. Said another way, we expect the action in crude oil prices for 2Q2016 to be contained between the range of $3.70 and $49.63. Remember, these levels are static until the end of 2Q2016.
On April 29, 2016, we calculated the monthly levels for May (along with previous month high, previous month low, and settlement price):
M4 = $58.38
M3 = $53.50
M1= $51.07
PMH = $46.78
Close = $45.92 (04/29/2016)
M2 = $35.30
PML = $35.24
M5 = $27.99
In isolation, you interpret this information in the following way. Once the market breaks above PMH, you have 1st resistance at $51.07 and 2nd resistance at $53.50. Clear that level and the exhaustion target is $58.38. 1st support is $35.30, followed closely by PML at $35.24. Once PML is cleared to the downside, the exhaustion target is $27.99. Said another way, we expect the price action in May to be contained between the range of $27.99 and $58.38. Remember, these levels are static until the end of May.
On April 29, 2016, we calculated the weekly levels for this week (along with previous week high, previous week low, and settlement price):
W4 = $54.56
W1 = $49.07
W3= $48.11
PWH = $46.78
W2 = $46.00
Close = $45.92 (04/29/2016)
PWL = $42.50
W5 = $40.51
In isolation, you interpret this information in the following way. Once market breaks above 1st resistance at $46.00, it is faced with resistance at PWH level of $46.78. 3rd resistance is at $48.11 and 4th resistance is at $49.07. Clear that level and the exhaustion target is $54.56. 1st support is PWL at $42.50. Once PWL is cleared to the downside, the exhaustion target for crude oil futures is $40.51. Said another way, we expect the action for crude oil prices this week to be contained between the range of $40.51 and $54.56. Remember, these levels are static until the end of this week.
On April 29, 2016, we calculated the daily levels for 05/02/2016 (along with previous day high, previous day low, and settlement price):
D4 = $48.62
D1 = $47.42
PDH = $46.78
Close = $45.92 (04/29/2016)
D3= $45.81
D2 = $45.54
PDL = $45.24
D5 = $44.34
In isolation, you interpret this information in the following way. 1st resistance is PDH level of $46.78.
Next resistance is $47.42. Clear that and exhaustion target is $48.62. 1st support is $45.81, next support is $45.54. Once PDL level of $45.24 is cleared to the downside, the exhaustion target is $44.34.
Said another way, we expect the price action for 05/02/2016 on crude oil futures to be contained between the range of $44.34 and $48.62. Remember, these levels are only good for the 05/02/2016 trading session.
In reality, you need to understand that different market participants focus on different time periods.
The point being that all levels in all time periods are relevant and interact with one another. Identify clustered support and resistance levels across time periods. A move above/below clustered levels is more significant than a single level in isolation. For example, 05/02 has clustered resistance basically from $46.00 to $46.78. Support is clustered from $45.81 to $45.24.
One comment on exhaustion levels. How far along we are in the session (i.e., early/late in the day, week, month, quarter) determines when to fade the exhaustion levels. You get the feel for it through experience. The basic rule we use is if early in session and nothing fundamental has changed, we will fade the exhaustion levels. If late in the session, we don’t fade because market participants will probably pin the close at the high/low.
Located to the right of the ticker is the 20-day average true range. Levels that fall within the previous day settlement +/- the average true range are highlighted in yellow.
Thank you for reading. You can learn more about our trend following system here.
Twitter: @Techs_Global
The author may hold S&P 500 related securities at the time of publication. Any opinions expressed herein are solely those of the author, and do not in any way represent the views or opinions of any other person or entity.
 Rolling Over At Key Fibonacci Level?")


