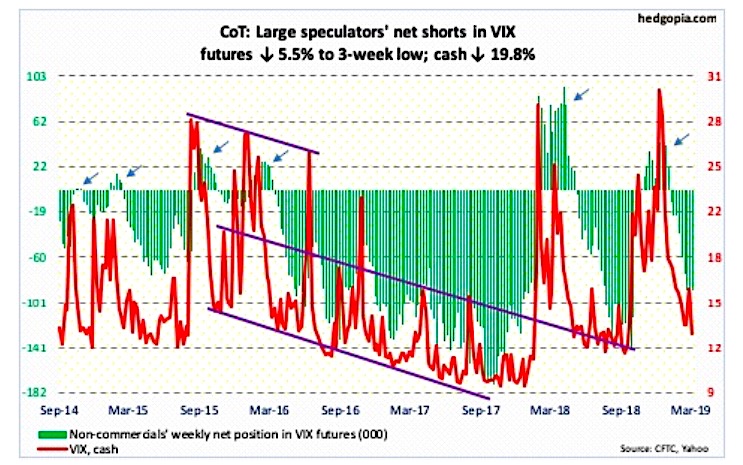
The chart below looks at non-commercial futures trading positions for the VIX Volatility Index. For the week the cash VIX Index traded sharply lower, falling 19.8%.
Here’s a look at VIX Volatility Index futures speculative positioning. Scroll further down for commentary and analysis.
Note that the chart and data that follow highlight non-commercial commodity futures trading positions as of March 12, 2018. This data was released with the March 15, 2019 COT Report (Commitment of Traders).
Note that this chart also appeared on my blog.
With stocks trading higher, volatility has been nearly non-existent. Will volatility bulls make return next week? Let’s look at the COT data and technicals to see what’s next.
VIX Volatility Index: Currently net short 89k, down 5.1k.
On Friday March 8, the VIX reached up near its 50 day moving average before turning lower. Then the bottom fellout, with a big drop this week.
Volatility bulls can take some solace in the fact that the VIX is currently trading into its lower Bollinger band. It’s also in oversold territory. That said, a failure to regain and hold above 13, will likely bring 11-12.
Looking elsewhere, the 21-day moving average of the CBOE equity-only put-call ratio has inched up to 0.619. The ratio has room to rise… usually stocks are ready to correct when the ratio hits the high-0.60s/low-0.70s.
Twitter: @hedgopia
Author may hold a position in mentioned securities at the time of publication. Any opinions expressed herein are solely those of the author, and do not in any way represent the views or opinions of any other person or entity.

 Testing Important Price Support")
: Cup (and Maybe Handle) Watch")

