The following is a recap of the December 30 COT Report (Commitment Of Traders Report) released by the CFTC (Commodity Futures Trading Commission) looking at COT data and futures positions of non-commercial holdings as of December 27.
Note that the change in COT report data is week-over-week. Excerpts of this blog post also appear on Paban’s blog.
3 Charts looking at Crude Oil, Gold, and US Dollar futures positions.
Crude Oil
Spot West Texas Intermediate crude oil ($53.72) continues to hover above support at $52, but not much progress has been made in the past three weeks. The last three sessions this week were spinning tops on the daily chart. The path of least resistance remains down.
Since OPEC’s output cutback deal on November 30, U.S. crude oil production has gone up, but not by a whole lot, although the risk is probably to the upside. In the week ended December 2, production was 8.7 million barrels per day. In the week ended last Friday, this stood at 8.77 mb/d, down 20,000 b/d week-over-week.
Crude oil imports fell by 304,000 b/d to 8.2 mb/d.
Stocks of gasoline and distillates fell, too, by 1.6 million barrels to 227.1 million barrels and by 1.9 million barrels to 151.6 million barrels, respectively.
Crude oil stocks, however, rose to 486.1 million barrels, up 614,000 barrels, to a four-week high. Refinery utilization dropped a tad, down 0.5 percent to 90 percent; the prior week was at a 13-week high.
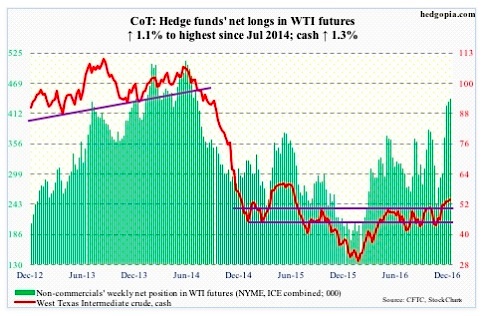
December 30 COT Report Data: Currently net long 439.1k, up 4.7k.
continue reading on the next page [Gold chart]…


