The following are charts and data showing non-commercial futures trading positions as of October 10, 2017.
This data was released with the October 13 Commitment of Traders Report (CoT). Note that these charts also appeared on my blog.
The charts below looks at non-commercial futures trading positions for the S&P 500 (INDEXSP:.INX) and VIX Volatility Index (INDEXCBOE:VIX).
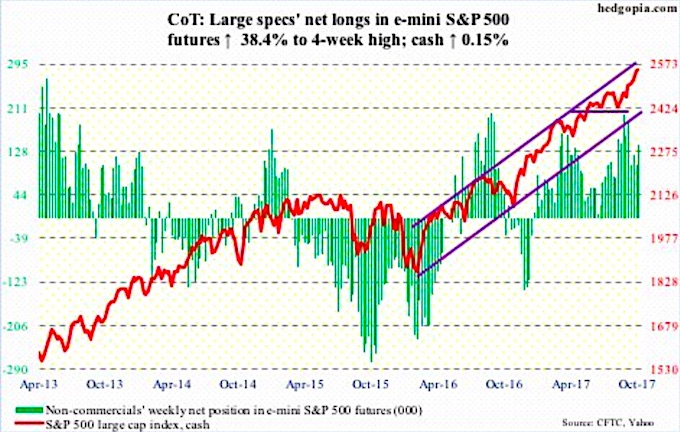
E-mini S&P 500 Futures: Currently net long 140.5k, up 39k.
U.S.-based equity funds in the week to Wednesday pulled in $2.9 billion (courtesy of Lipper).
In the same week, a total of $319 million moved into three S&P 500-focused ETF’s, with SPDR S&P 500 ETF (NYSEARCA:SPY) losing $892 million, and Vanguard S&P 500 ETF (VOO) and iShares core S&P 500 ETF (IVV) attracting $71 million and $1.1 billion, respectively (courtesy of ETF.com).
In a doji week, the cash managed a 0.15-percent rise, with some signs of fatigue beginning to show up. Yet, as overbought as it is, the index has not tested the 10-day in the last 11 sessions.
Besides the 10- and 20-day, the first layer of support lies at 2509, which it broke out of two weeks ago.
In the meantime, the ratio of Investors Intelligence bulls to bears this week posted four – a rare reading. This was the 16th such occurrence going back four years. If past is prologue, this can mark at least a short-term peak in stocks.
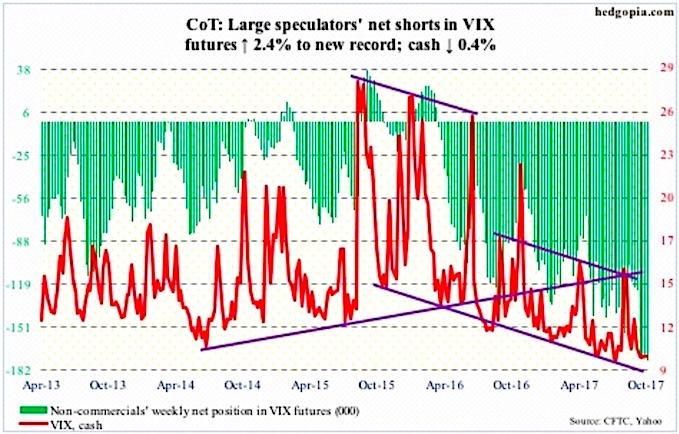
VIX Volatility Index: Currently net short 174.7k, up 4k.
Daily Bollinger bands on the cash continue to narrow, with the upper bound having provided resistance several times in the week. In the meantime, the 10- and 20-day are converging, even as the 50- and 200-day are flattish.
This is an opportunity for volatility bulls. Remains to be seen if they can cash in. Non-commercials are net short VIX futures up to their eyeballs – record this week – and, if squeezed, can provide a huge tailwind to the cash.
Thanks for reading.
Twitter: @hedgopia
Author may hold a position in mentioned securities at the time of publication. Any opinions expressed herein are solely those of the author, and do not in any way represent the views or opinions of any other person or entity.


")


")
 Rolling Over At Key Fibonacci Level?")