The following are charts and data showing non-commercial futures trading positions as of October 31, 2017.
This data was released with the November 3 Commitment of Traders Report (COT). Note that these charts and excerpts also appeared on my blog.
The charts below looks at non-commercial futures trading positions for the S&P 500 (INDEXSP:.INX), Russell 2000 (INDEXRUSSELL:RUT) and VIX Volatility Index (INDEXCBOE:VIX).
E-mini S&P 500: Currently net long 161.3k, up 34.2k.
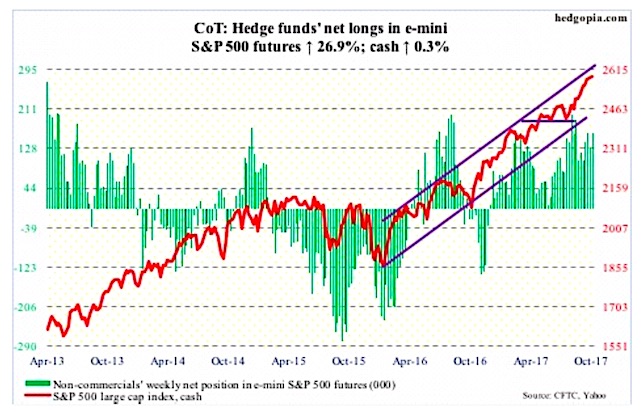
In the week to Wednesday, SPY (SPDR S&P 500 ETF) experienced outflows in all five sessions, totaling $5.1 billion (courtesy of ETF.com). VOO (Vanguard S&P 500 ETF) and IVV (iShares core S&P 500 ETF), however, saw combined inflows of $2.9 billion to minimize the damage.
In the same week, another $3.6 billion moved into U.S.-based equity funds, following inflows of $13 billion in the prior three (courtesy of Lipper).
Despite these flows, momentum arguably is decelerating. The S&P 500 Index did rise to an all-time high of 2588.42 Friday, with eight consecutive weekly gains, but once again the bulls were forced to defend the 20-day Thursday.
VIX: Currently net short 145.3k, down 3.4k.
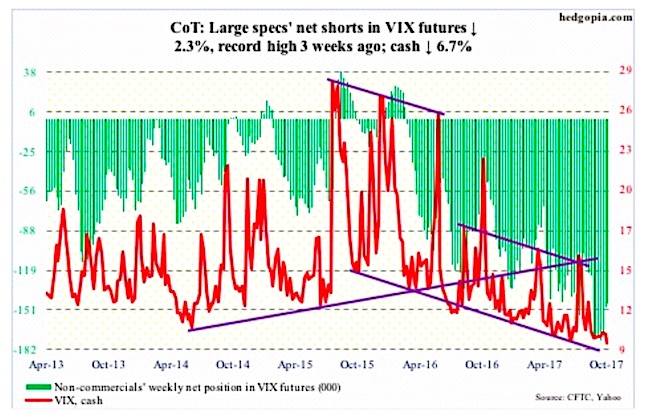
The VIX Volatility Index sought to rally past the 50-day in three sessions, but was rejected. In four out of five, VIX dipped sub-10 intraday, going even sub-nine Friday.
On a weekly basis, the VIX has closed sub-10 for seven consecutive weeks. Talk about volatility suppression.
The VIX-to-VXV ratio closed out the week at .736, which was the lowest since mid-August 2012.
Amidst all this, non-commercials have been quietly reducing net shorts. Not a whole lot, but a reduction nonetheless – from record 174,665 contracts three weeks ago to 145,300.
Friday, VIX closed right on the daily lower Bollinger band. At least a bounce is due.
Thanks for reading.
Twitter: @hedgopia
Author may hold a position in mentioned securities at the time of publication. Any opinions expressed herein are solely those of the author, and do not in any way represent the views or opinions of any other person or entity.


")


