The following are charts and data showing non-commercial futures trading positions as of December 12, 2017.
This data was released with the December 15 COT Report (Commitment of Traders). Note that these charts also appeared on my blog.
The 3 charts below look at non-commercial futures trading positions for Crude Oil, Gold, and the US Dollar.
For the week, the Gold ETF (NYSEARCA:GLD) was up +0.6%, the Crude Oil ETF (NYSEARCA:USO) was down -0.2%, and the US Dollar Index was flat for the week.
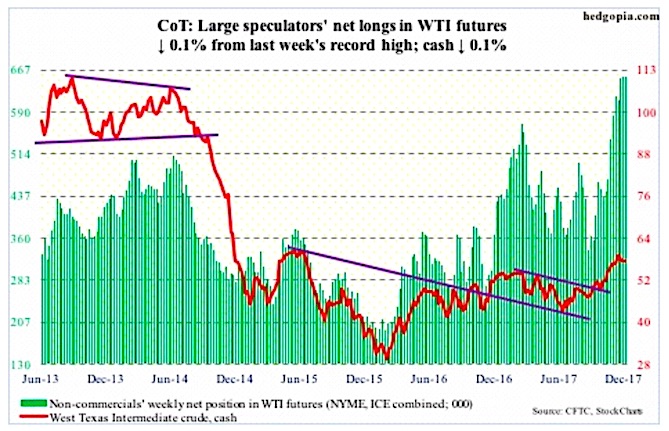
CRUDE OIL
December 15 COT Report Spec positioning: Currently net long 654k, down 785.
The 100-mile-long Forties pipeline – the North Sea’s most important, transporting 450,000 barrels per day – was shut down for at least a couple of weeks after Ineos, the owner, discovered a widening crack.
Crude oil was bid up on the news, but both spot West Texas Intermediate crude and the Brent were unable to hang on to the gains.
WTI crude oil ($57.33/barrel) in particular has made lower highs since peaking at $59.05 on November 24. There is currently a tug of war between oil bulls and bears around shorter-term moving averages. The former camp cannot afford to lose support at $54-55. The 50-day lies at $55.12.
Non-commercials hold near-record net longs. The risk at this stage is if and when they decide to unwind.
In the meantime, as per the EIA report for the week of December 8, U.S. crude production continued to increase – up 73,000 b/d to 9.78 million b/d. Since OPEC and Russia reached a deal in November last year to cut production by 1.8 mb/d, U.S. production has gone up by 1.08 mb/d.
Gasoline stocks rose as well, up 5.7 million barrels to 226.5 million barrels. Ditto with crude imports, which increased 161,000 b/d to 7.36 mb/d.
Refinery utilization inched down four-tenths of a point to 93.4 percent.
Distillate stocks, however, dropped 1.4 million barrels to 128.1 million barrels. As did crude oil stocks, which fell 5.1 million barrels to 443 million barrels – the lowest since October 2015.
GOLD
December 15 COT Report Spec positioning: Currently net long 107.1k, down 66.3k.
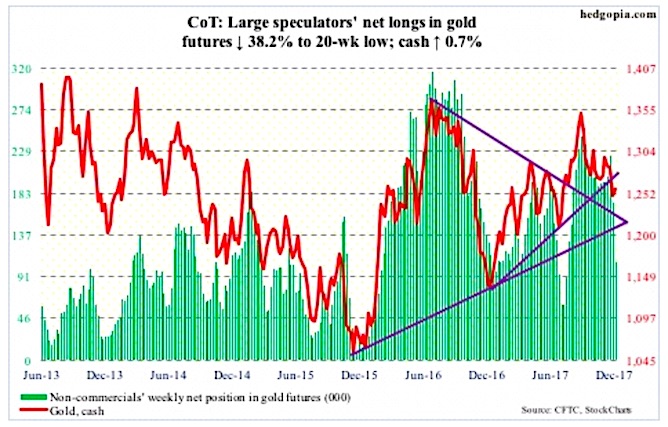
Gold bugs put the foot down well before support at $1,200/ounce could be tested on the cash ($1,257.50). There is work ahead, though.
Both Thursday and Friday, the metal faced resistance at the underside of a broken trend line from December last year. Once this is broken through, the 200-day ($1,268.33) lies right above, followed by stiff resistance at $1,300.
There is room to rally near- to medium-term. Flows need to cooperate.
In the week to Wednesday, per ETF.com, IAU (iShares gold trust) took in $51 million, which was offset by outflows of $49 million from GLD (SPDR gold ETF).
More important is if non-commercials, having cut net longs to a 20-week low, begin to rebuild.
US DOLLAR INDEX
December 15 COT Report Spec Positioning: Currently net short 5.7k, up 2.8k.
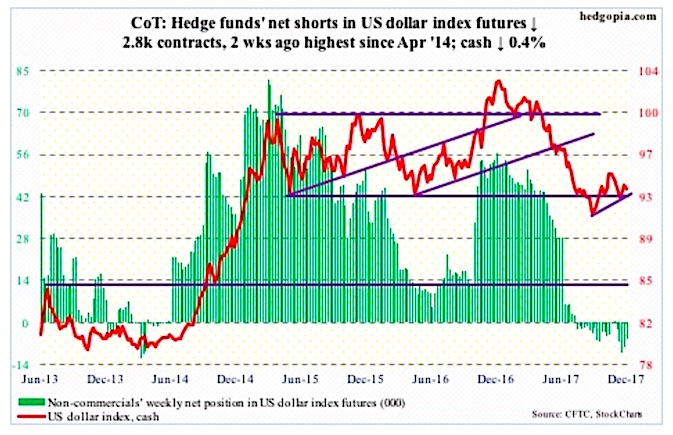
Resistance at 94 and change once again proved too tough to crack. Tuesday, the cash (93.46) rallied to 94.21, but only to be followed by a reversal, slicing through the 50-day.
The latest rally came off of the bulls’ defense of range support at 92-93. This now also approximates the daily lower Bollinger band.
Non-commercials continue to remain on the sidelines.
Twitter: @hedgopia
Author may hold a position in mentioned securities at the time of publication. Any opinions expressed herein are solely those of the author, and do not in any way represent the views or opinions of any other person or entity.
")


 Rolling Over At Key Fibonacci Level?")


