U.S. corporate bond issuance totaled $99.7 billion in July, down 25.9 percent year-over-year. Of this, investment-grade was $85.2 billion, down 32.1 percent y/y and high-yield $14.5 billion, up 62.2 percent. The growth rate put up by high-yield is misleading as it was way suppressed last year.
In the first seven months this year, high-yield issuance (NYSEARCA:HYG) totaled $134.8 billion, down 29.5 percent y/y. On this basis, investment-grade (NYSEARCA:LQD) declined 3.1 percent. As did total issuance, which fell eight percent.
Given this, solely annualizing the seven-month total may not give us a true picture as to where 2016 might end up. On an annualized basis, 2016 is on course for $1.61 trillion in corporate bond issuance – yet another record (Chart 1 below). But then again, annualizing the first seven months, 2015 should have come in at $1.75 trillion; actual issuance was $1.49 trillion.
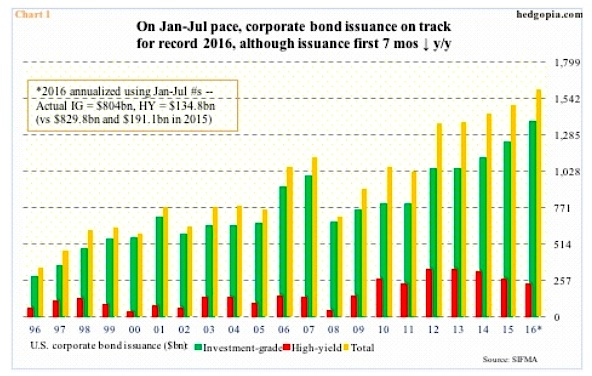
The important thing to keep in mind is that corporate bond issuance year-to-date is softer versus last year.
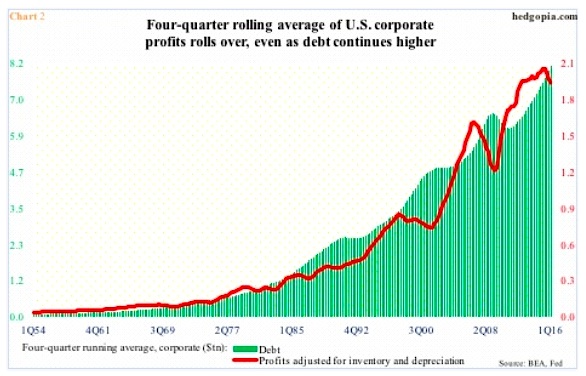
This in some ways is in keeping with Chart 2 (below), which plots corporate debt with profits adjusted for inventory and depreciation, using a four-quarter running average. The latter peaked at $2.1 trillion in 2Q15 (actual peak was in 3Q14 at $2.16 trillion), while the former was still going strong at $8.1 trillion in 1Q16 (actual was $8.28 trillion in 1Q16). Turns out the red line tends to lead the green bars. Has not happened yet, but might, if past is prologue. This is a medium- to long-term issue.
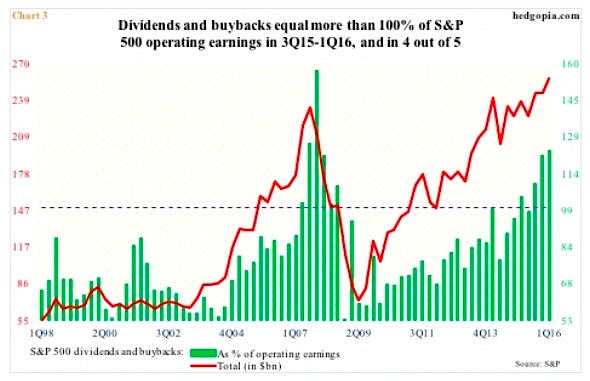
Near-term, or immediately ahead, implications of softer debt issuance are likely to be felt in Chart 3 (below).
S&P 500 companies (INDEXSP:.INX) have been spending gobs of money buying back shares, totaling $161.4 billion in 1Q16. This was the highest since $171.9 billion in 3Q07. This is no chump change. As a matter of fact, including dividends of $96.3 billion, the combined $257.7 billion constituted 123.3 percent of 1Q16 operating earnings of $209 billion. This was the third straight quarter dividends and buybacks made up more than 100 percent of operating earnings … and in four out of five. Clearly not sustainable.
At this time, corporations can least afford to issue less debt. A lot is riding on Chart 1, and the remaining five months of the year.
Thanks for reading.
Twitter: @hedgopia
Read more from Paban on his blog.
Any opinions expressed herein are solely those of the author, and do not in any way represent the views or opinions of any other person or entity.


