I spent the early part of this week at the 2016 National Ethanol Conference in New Orleans. All anyone had to do was take one quick glance at the list of attendees to notice the immediate and inseparable link between ethanol and corn.
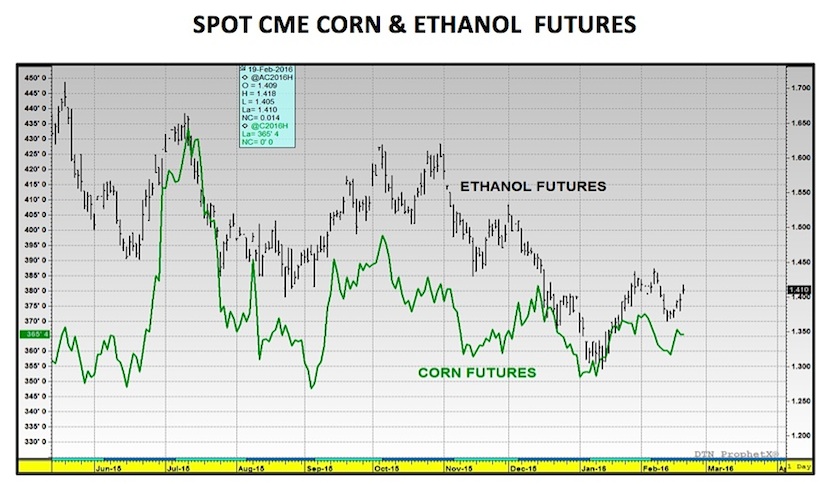
I’ve noted in previous columns that nearly 40% of total U.S. corn demand over the last two years has been dedicated to ethanol production, with corn representing the primary feedstock for conventional biofuels. Therefore it stands to reason that the current and future profitability of this industry will have a significant and lasting impact on the price of corn, arguably more than any other. That said the EIA’s Weekly Petroleum Status Report (which publishes current ethanol S&D figures) has become a key, consistent focus for corn traders. The ability to accurately anticipate the potential future trends in both ethanol production and ethanol stocks as it relates to total U.S. gasoline demand and ethanol’s implied available market share has often helped shape the eventual trend in corn futures (note price pattern similarities between corn futures and ethanol futures in a chart further down below).
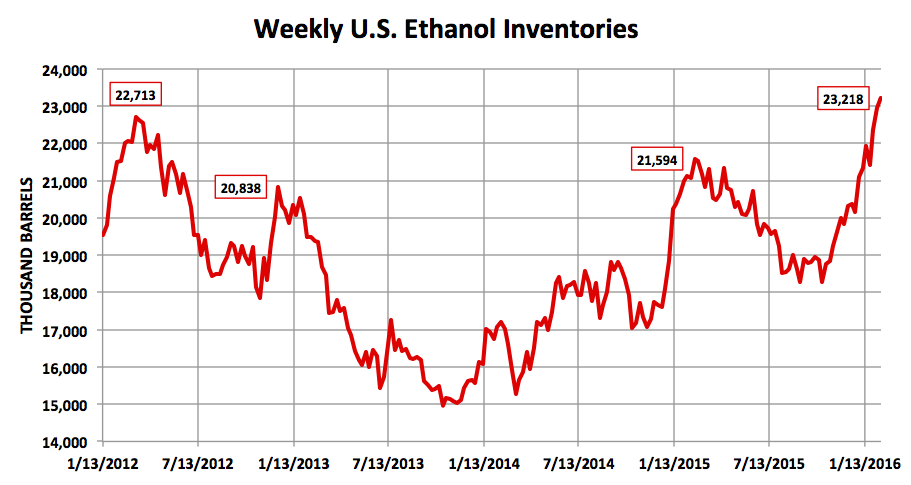
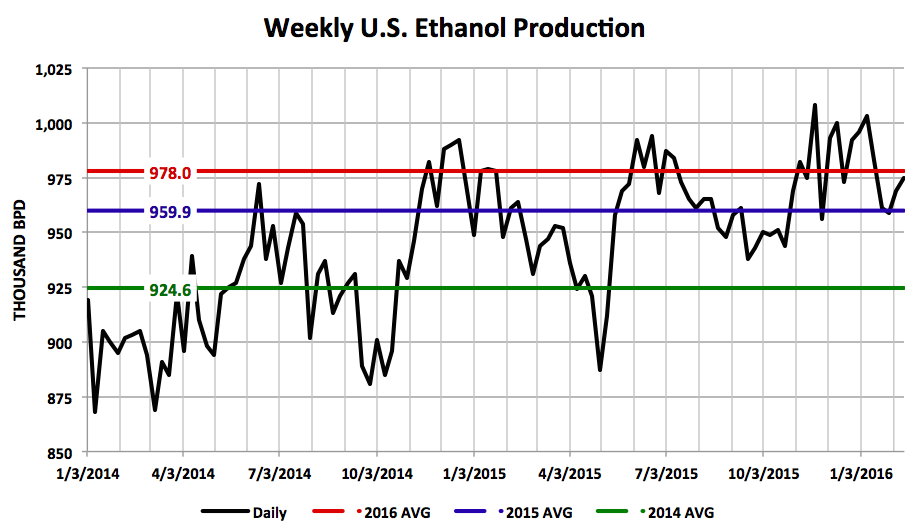
This week’s report showed U.S. ethanol stocks increasing to a new record high of 23.218 million barrels, an increase of 262,000 barrels versus a week ago. Prior to 2016, the old record high for ethanol stocks was 22.713 million barrels, which was established on March 16th, 2012. Weekly ethanol production averaged 975,000 barrels per day, 9,000 bpd above the 4-week average. Despite record ethanol stocks and an accelerated industry run-rate (2016 weekly ethanol production has thus far averaged 978,000 bpd versus the 2015 average of 959.9k) CBOT ethanol futures were still trading approximately 10-cents per gallon above the current 2016 low of $1.296 from January 13th as of the 2/19/16 market close; however how long that can be sustained remains to be seen.
What message is the latest ethanol S&D balance sheet attempting to tell U.S. ethanol producers? Slow Down. Even with U.S. gasoline demand recovering this week to more than 9.2 million barrels per day versus just 8.34 million two weeks ago, U.S. ethanol inventories continue to rise to unprecedented levels. Conversely, the average industry spot ethanol margin in Iowa is descending just as quickly, now trading below breakeven levels in several locations. However, given the corn basis premiums currently being paid in the Eastern Corn Belt, my assumption is ethanol plants in Indiana and Ohio are under the most acute margin pressure.
How long does it take for ethanol plants to respond to negative margins? That’s not an easy question to answer because of every plant’s unique competitive advantages and disadvantages related not only to plant location (i.e. corn and ethanol basis values) but also its ethanol yield and co-product configuration. However generically speaking the reality is in most cases the decision to run at a reduced rate comes back to whether or not the plant is actually burning cash and operating at a negative EBITDA. Based on current market values I don’t believe enough of the industry has penetrated this critical threshold, which invariably means more pressure will need to be exerted on ethanol margins to stop the continued increase in U.S. ethanol stocks.
What’s the potential impact on corn futures short-term? In the February 2016 WASDE report the USDA increased 2015/16 corn-ethanol demand 25 million bushels to 5,225 million versus 5,209 million a year ago. I don’t think that number can go much higher in proceeding crop reports based on what I’m seeing presently from a margin perspective in ethanol. Therefore for those Corn Bulls hoping that record weekly ethanol production will help offset continued decreases to U.S. corn exports as far as negating additional 2015/16 US corn ending stocks increases I don’t see that as a viable outcome. Consequently negative ethanol margins should also be viewed as another negative for corn futures short-term.
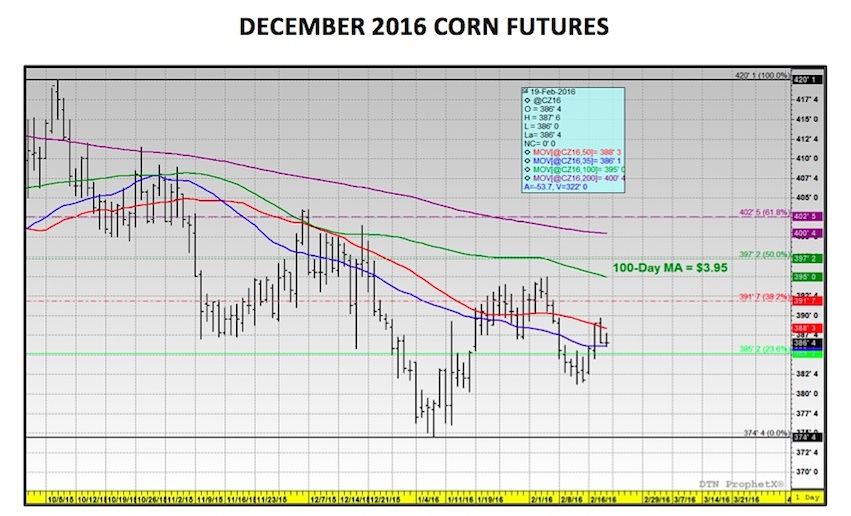
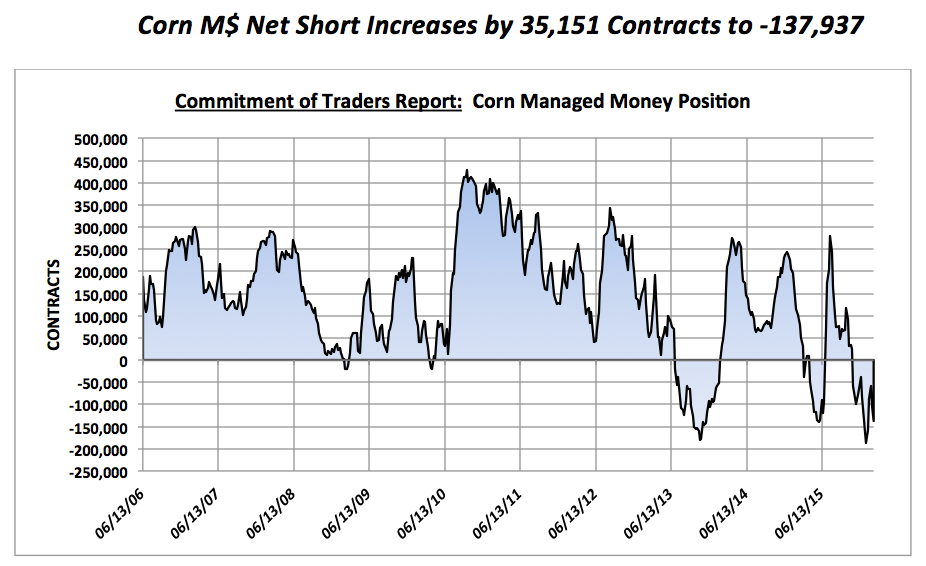
CURRENT CORN PRICE CONSIDERATIONS: March corn futures traded 6 ¾-cents per bushel higher week-on-week, finishing at $3.655 on 2/19. Considering Money Managers were once again strong net sellers in corn, increasing their net corn short to -137,937 contracts as of the close on 2/16, Corn Bulls should feel somewhat positive about this week’s price action. Even more importantly for producers, new-crop December 2016 corn futures (CZ6) posted a close back over the 35-day moving average Friday afternoon (closing at $3.865). The 50-day moving average should act as immediate overheard resistance Monday morning at $3.883; however I wouldn’t be surprised to see corn push through that level and work back up toward the higher end of the recent trading range at $3.95. This area also coincides with the 100-day moving average (see chart below).
Does corn have any sound fundamental or technical reason to rally into last half February and/or first half March? At the moment, I can’t create much of a case for sustained rallies above $4.00 to $4.05 on December 2016 corn futures with U.S. 2015/16 corn ending stocks still resting comfortably over 1,800 million bushels. However the following are two potentially supportive storylines over the next 15 to 30-days to keep an eye on:
1. The USDA’s 92nd annual Agricultural Outlook Forum will take place next Thursday and Friday in Arlington, Virginia, which includes such notable speakers as Secretary of Agriculture Tom Vilsack. From this forum, the market should learn some of the USDA’s initial U.S corn and soybean acreage, yield and demand assumptions for 2016. It’s possible the USDA could offer something in the form of smaller than expected acreage figures for either corn or soybeans in 2016 relative to some of the recent private estimates the market has been trading (due to the continuation of depressed CME corn and soybean prices combined with stubbornly high input costs).
2. I’ve recently been commenting on the consistency of a higher corn price seasonal in both the 5 and 10-year patterns into and through end of March. And while I still believe this year’s “rally” will be harder to sustain due to surplus U.S. and World corn ending stocks the fact that March corn futures continue to trade 17-cents above the current 2016 CH6 low of $3.485 (established on January 7th) despite heavy Managed Money selling remains a positive for Corn Bulls. Market psychology naturally shifts to a more supportive undertone as the calendar inches closer and closer to spring planting. Therefore, the combination of a market that doesn’t seem to be able to make new lows even with active managed money selling along with the need to start building back in a weather premium for March and April, and the 2016 corn crop, this could create some upward momentum in corn prices as early as next week.
Thanks for reading.
Twitter: @MarcusLudtke
Author hedges corn futures and may have a position at the time of publication. Any opinions expressed herein are solely those of the author, and do not in any way represent the views or opinions of any other person or entity.
Data References:
- USDA United States Department of Ag
- EIA Energy Information Association
- NASS National Agricultural Statistics Service

: Worrisome to Broader Market?")

