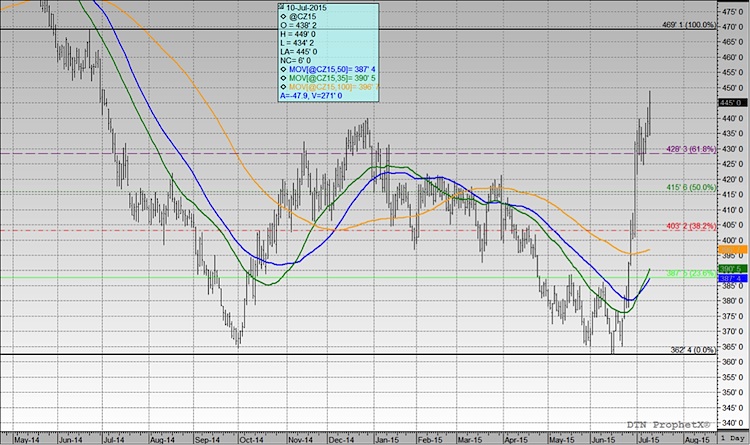
On Friday the USDA released the July WASDE report. The immediate price reaction in corn and soybeans was lower; however both markers recovered quickly and eventually closed higher on the day with December corn futures closing at $4.45 and November soybean futures closing at $10.22 ¼. The following is a summary of the USDA’s latest supply and demand estimates, as well as a summary on soybeans in particular.
On Thursday, November soybeans closed 27 ½-cents higher with the market looking to put a premium back into futures values prior to the release of the July Crop report. Speculation had been building all week that the USDA was likely to lower the US soybean yield on account of all the excessive moisture in Missouri, Indiana, Illinois, and Ohio. Since the USDA’s June 7th Weekly Crop Progress report, Indiana and Illinois specifically, had seen their state soybean good-to-excellent ratings fall 22 and 27 percentage points respectively through July 5th. Furthermore Missouri’s soybean crop was still just 73% planted, suggesting that approximately 1.5 million soybean acres remained unplanted. However, in a move that is somewhat true to form for the USDA in the July report, they chose to leave the 2015/16 US soybean yield unchanged versus a month ago at 46 bushels per acre.
Why wasn’t the yield lowered? The reality is July yield decreases from the USDA have historically been very uncommon. Over the last 10 years the USDA has only lowered the US soybean yield on 2 occasions in the month of July. In 2012, the USDA lowered the soybean yield 3.4 BPA, and in 2008, they dropped it by 0.5 Bushels Per Acre (BPA). My assumption is the USDA is waiting to make a yield adjustment until the August WASDE report, which comes out on August 12th. The history for the August Crop report is quite different, with yield adjustments almost a given. In fact, since 2005 the USDA has lowered the US soybean yield in 7 out of 10 years in the August report by an average of 1.8 BPA. The largest, non-2012, monthly yield reduction came in 2013 and totaled 1.9 BPA. Therefore looking ahead to next month’s Crop report, history would seem to support, as do the latest crop condition ratings, a US soybean yield estimate closer to 44.5 BPA. If that were to occur and assuming harvested soybean acreage remains unchanged at 84.4 million acres, the net downward adjustment to total US soybean production would be 130 million bushels. I do sense a majority of the players in the soybean market are leaning this way, expecting some form of a yield decrease, as well as, a possible decrease to harvested acreage given Missouri’s inability to get its crop planted.
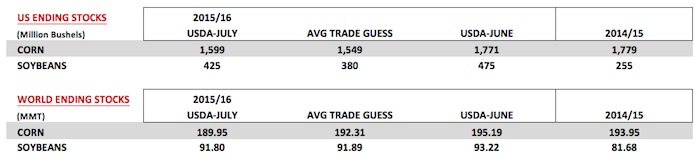
 Other notables from the report included a 75 million bushel cut to 2015/16 US carryin stocks, which fell to 255 million bushels versus the average trade guess of 287 million. Despite the unchanged yield, total US soybean production actually increased 35 million bushels month-on-month due to harvested acreage increasing 700,000 acres in the June 30th Acreage report. On the demand side of the balance sheet, the USDA raised the soybean crush 10 million bushels to 1,840 million. Exports were left unchanged at 1,775 million versus 1,825 million in 2014/15. The net result of all the changes made by the USDA was a 2015/16 US soybean carryout of 425 million bushels versus 475 million in June and an average trade guess of 380 million.
As far as the world numbers were concerned, world soybean stocks fell to 91.8 MMT versus 93.2 MMT in June; however it should be noted that despite the minor decrease, world inventories remain record large, exceeding the previous record by 10.1 MMT or 371 million bushels. Brazil’s 2014/15 soybean production was estimated at 94.5 MMT and a record 97.0 MMT for 2015/16. Argentina’s 2014/15 soybean production was estimated at 60.0 MMT and 57 MMT for 2015/16. Brazil and Argentina are the world’s 2nd and 3rd largest soybean producers in the world trailing only the United States. In the past 10-years Brazil’s soybean production has grown by 40 MMT with Brazil now expected to export more soybeans than the US in 2015/16. China, the world’s largest soybean importer, had 2015/16 imports projected at 77.5 MMT, which was unchanged versus June, and up 3.5 MMT relative to a year ago.
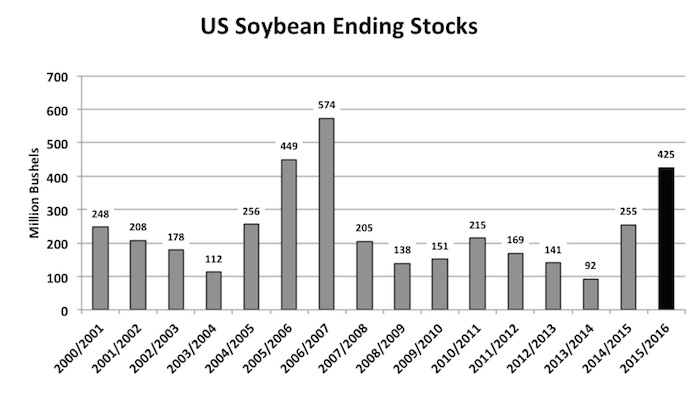
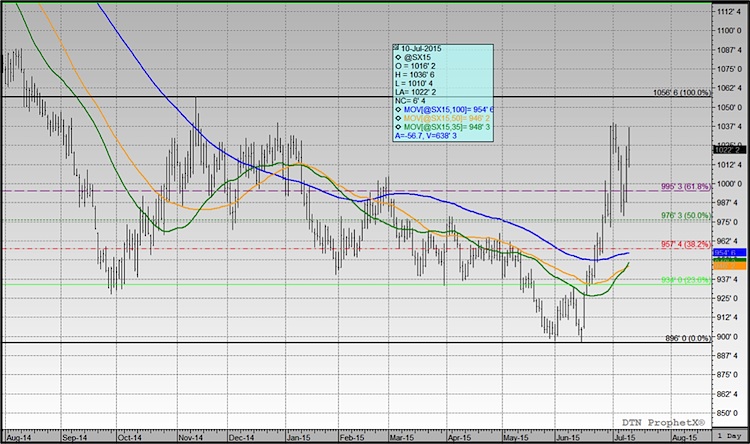
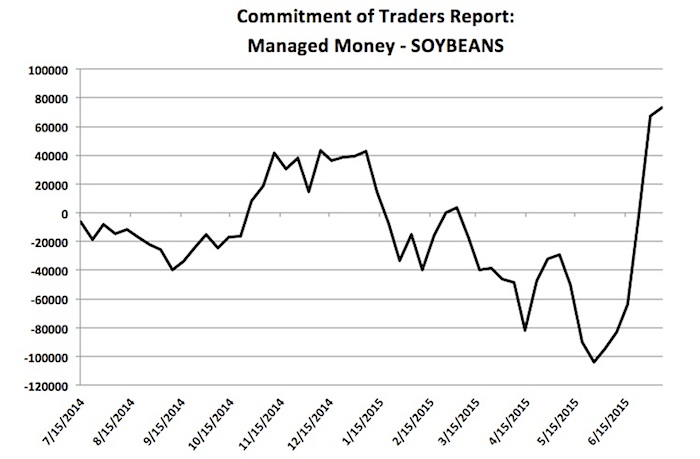
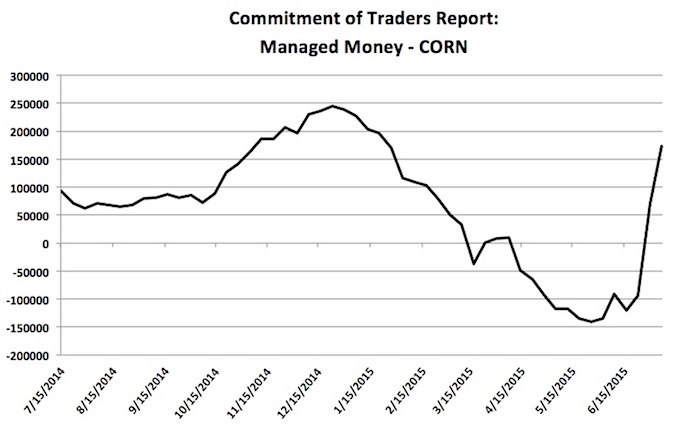
Given the updated US and World July soybean supply and demand estimates, where does the market go from here? If the managed money is any indication, it appears as though several traders still want to own both corn and soybeans. In Friday’s Commitment of Traders report the managed money net long in soybeans increased by 5,660 contracts week-on-week to 73,256 contracts. In corn the paper flow was even more impressive with the managed money net long exploding to 173,280 contracts, up 102,674 contracts versus a week ago. From purely a fundamental perspective I’m not convinced more upside is warranted in either corn or soybeans at this time. November soybeans have already rallied approximately $1.26 per bushel from the day low established on June 15th through today’s close. Assuming the US soybean yield is lowered to 44.5 BPA and no adjustments are made to the demand side of the equation, 2015/16 US soybean stocks would still pencil back at nearly 300 million bushels versus the 5-year average of 174 million. Add to that a record world soybean carryout, as well as, record soybean production in Brazil, and it becomes more and more difficult in my opinion to paint a long-term bullish, supply-side scenario. That said, current momentum via the money flow still has this market trending higher and that support is unlikely to dissolve quickly until traders and end users have a better sense of how many acres weren’t planted in Missouri, as well as, how many bushels have been lost in Illinois, Indiana, and Ohio. Technically, the current high on July 1st in November soybeans of $10.40 per bushel should act as initial resistance early next week, followed by the November 12th, 2014 high of $10.56.
November Soybeans Prices (futures) Chart
December Corn Prices (futures) Chart
A Look At COT Report Data…
Thanks for reading and have a great week.
Data References:
- USDA United States Department of Ag
- EIA Energy Information Association
- NASS National Agricultural Statistics Service
Any opinions expressed herein are solely those of the author, and do not in any way represent the views or opinions of any other person or entity.


 and Semiconductors (SMH): Concerning Price Pattern?")


