While copper has seen a sizable rally off the 2016 lows, it’s still in a downtrend. And this trend currently appears to be ready to continue lower based on a number of notable headwinds. Bearish headwinds include current price action, momentum, seasonality, and money flow. I’ll dig into each of these topics in the paragraphs below to show why we may start seeing lower copper prices in the coming weeks/months.
Price Action
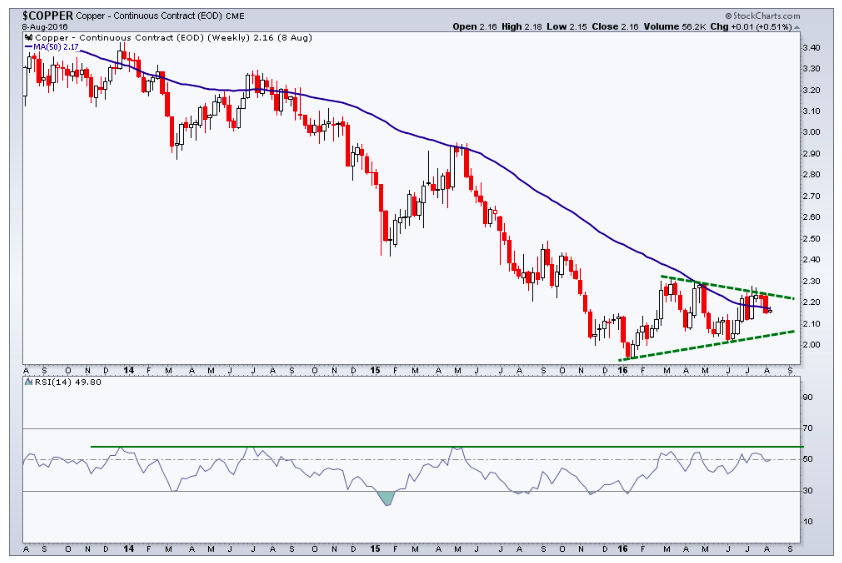
First lets look at the weekly chart of copper futures prices (HG_F). We can clearly see that copper has been in a multi-year down trend, partially defined by the 50-week Moving Average (MA) which has acted as a level of resistance on counter-trend rallies. Copper broke above its 50-week MA for a couple of weeks in July but has since returned back under the moving average. I’ve drawn a symmetrical triangle around the price action for 2016 to show levels of resistance and support. A break of the lower highs or the higher low would be key in defining the next leg of price action.
However, the range that momentum (as measured by the Relative Strength Index (RSI) in the bottom panel) appears to still be in a bearish range. The RSI has stalled on counter-trend rallies around the 60 area, which is where it’s near right now. From a price and momentum perspective, copper has some work to do in order for the bulls to keep the current short-term advance going.
Money Flow
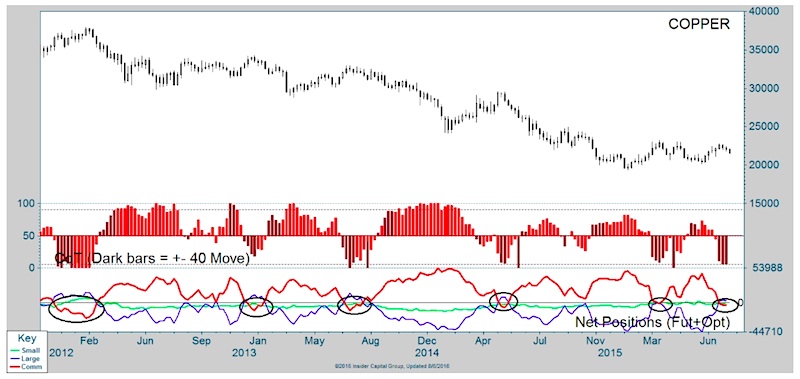
Next up we have the Commitment of Traders (COT) data. The red line in the bottom panel of the chart below shows the net position of Commercial Traders (often dubbed the ‘smart money’). Typically Commercial Traders remain net-long copper, but when they do shift to a net-short position, copper prices have begun to struggle as noted by the black circles around previous instances. We are seeing similar sentiment right now as the Commercials have moved back to a net-short position over the last couple of weeks. If history is our guide, this doesn’t bode well for copper.
Finally, we have seasonality, with this chart from SentimenTrader. Like many markets, especially commodities, copper traders in a nice seasonal pattern. You’ll notice that copper prices have typically topped out around August with the average monthly performance for September and October being negative.

So we have price sitting under resistance with momentum also tucked under its previous levels of resistance. The ‘smart money’ has shifted to a net-short position and seasonal winds have changed direction and now are creating headwinds for copper. With price, momentum, money flow, and seasonality all showing a bearish slant for copper it’s hard to make an argument for copper prices to materially continue to rise from here.
Thanks for reading.
The information contained in this article should not be construed as investment advice, research, or an offer to buy or sell securities. Everything written here is meant for educational and entertainment purposes only. I or my affiliates may hold positions in securities mentioned.
Twitter: @AndrewThrasher
Any opinions expressed herein are solely those of the author, and do not in any way represent the views or opinions of any other person or entity.


 Showing Bullish Buy Potential")


