Looks like the historic run higher in copper prices may be taking a breather.
While we cannot say that the LONG-term rally is over. It definitely has put in an intermediate top.
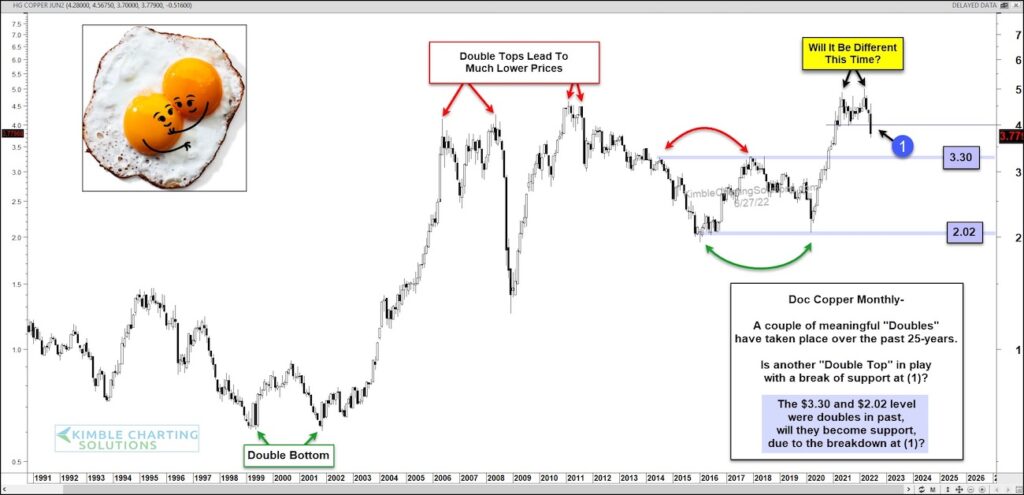
Back in March, we wrote about this possibility in our article, “Is Copper Repeating Historic Double Top Price Pattern?” There have been two other historic double tops that have taken place in the past 20 years.
Well, here we are today and the double top pattern is breaking down and Doc Copper is on the ropes. Below is an updated “monthly” chart with some of our thoughts.
Right now Copper is attempting to break down below 15-month support at (1). This could lead to support at 3.30 (prior double top resistance), or potentially as low as 2.02 (prior double bottom support).
This is a monthly chart so bulls need copper to recover quickly… or else there could be a big decline. Stay tuned!
Copper Futures “monthly” Price Chart
Note that KimbleCharting is offering a 2 week Free trial to See It Market readers. Just send me an email to services@kimblechartingsolutions.com for details to get set up.
Twitter: @KimbleCharting
Any opinions expressed herein are solely those of the author, and do not in any way represent the views or opinions of any other person or entity.

: Worrisome to Broader Market?")
