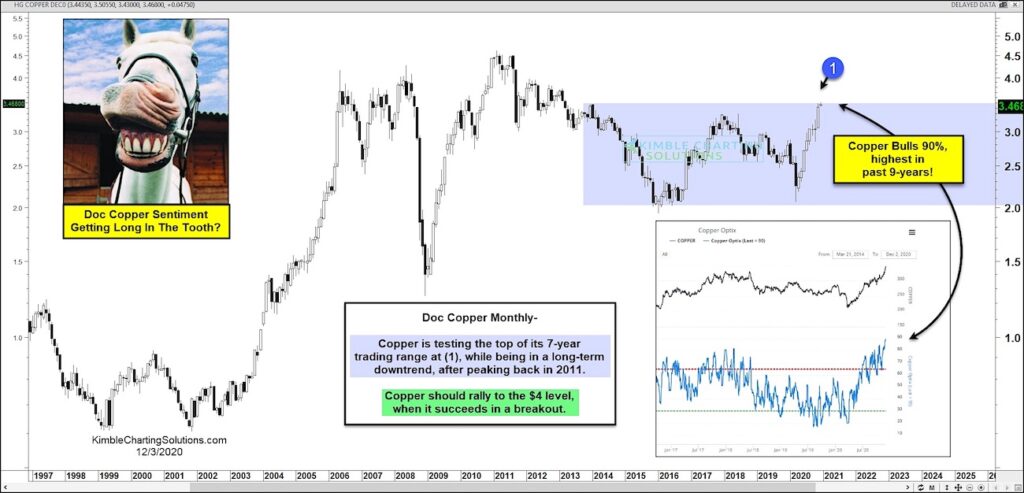
Copper has rallied in a straight line higher for the past several months. But this rally may be overheating right now!
In today’s chart, we look at the past 25 years of copper prices on a “monthly” basis. As you can see, Doc Copper peaked in 2011 and traded “heavy” for several years… until this year.
The rally that has unfolded has been so powerful that investors have gone from bearish to super-bullish just as Copper prices reach the top of a 7-year trading range at (1). By super-bullish I mean 90% are bulls, the highest in 9 years for Doc Copper!
While a successful breakout would likely propel Copper to $4, the metal is sending a cautious message here with so many bulls. Stay tuned!
Note that KimbleCharting is offering a 2 week Free trial to See It Market readers. Just send me an email to services@kimblechartingsolutions.com for details to get set up.
Twitter: @KimbleCharting
Any opinions expressed herein are solely those of the author, and do not in any way represent the views or opinions of any other person or entity.
: Cup (and Maybe Handle) Watch")
 Trading Near Top Of Price Range")
 Reaches Important Price Support")