The consumer has always been a good gauge of the U.S. economy.
Similarly, investors can gauge the health of the stock market by looking at consumer stocks.
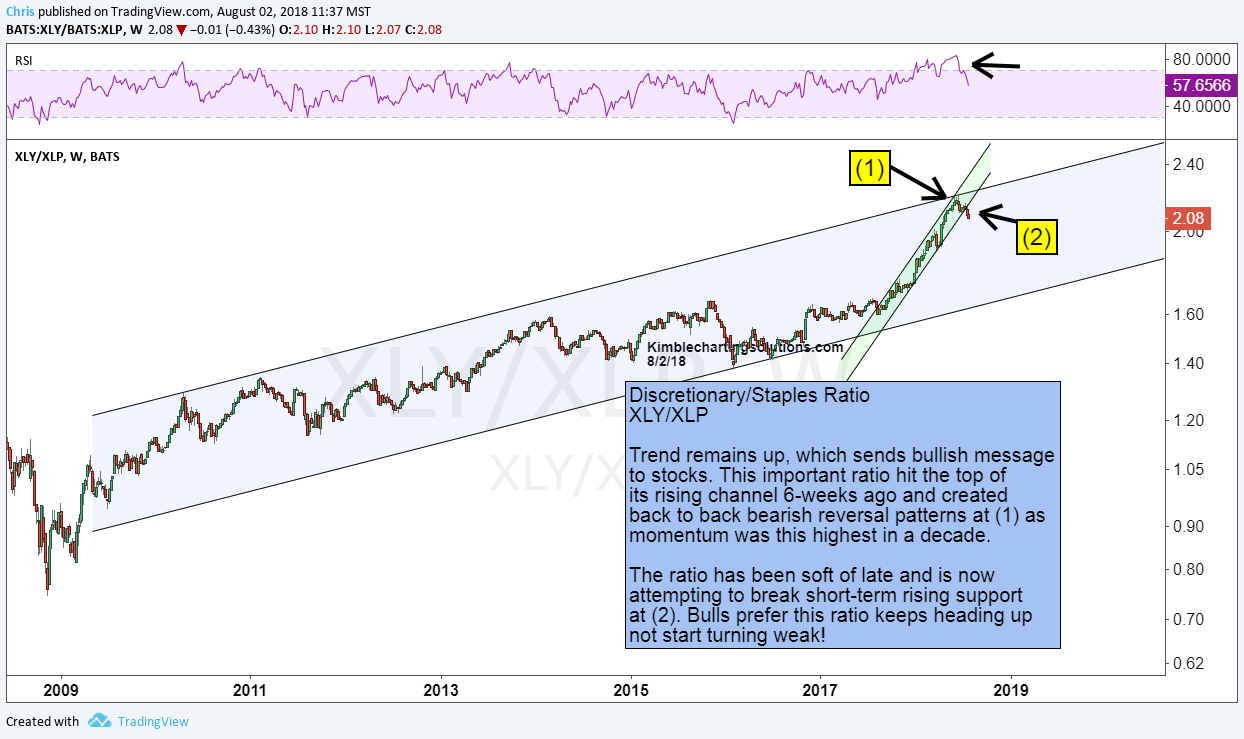
One way to gauge this is to look at the ratio of the Consumer Discretionary Sector ETF (NYSEARCA: XLY) to the Consumer Staples Sector ETF (NYSEARCA: XLP). The former represents growth and a higher risk appetite, while the latter represents steady, lower growth (defensive) and lower risk appetite.
If a market is healthy and strong, then the ratio should be heading higher. When the market is concerned or uncertain, the ratio tends to head lower.
We track this ratio in the chart below.
Since the 2009 bottom, the ratio has taken the shape of a bullish trend channel.
Zooming in, we can see that the ratio has been on a tear higher since early 2017, riding a tight uptrend channel higher.
Concerns rising… This important ration hit the top of the rising channel 6 weeks ago and created back to back bearish reversal patterns (at point 1). The RSI Momentum Index also reached its highest reading in a decade.
The ratio has been soft of late and is now attempting to break below short-term rising support (at point 2).
The trend is still “up” (higher lows), however a break of this support adds to the idea that near-term risk may be rising as investors favor Consumer Staples. Stay tuned!
Consumer Discretionary vs Consumer Staples Ratio
Note that KimbleCharting is offering a 30 day Free trial to See It Market readers. Just send me an email to services@kimblechartingsolutions.com for details to get set up.
Twitter: @KimbleCharting
Any opinions expressed herein are solely those of the author, and do not in any way represent the views or opinions of any other person or entity.


