Watching and trading the markets thus far in 2014, it’s become quite clear to me that this isn’t the 2013 playbook anymore. 2013 was the year of “buying the dip.” This year seems like it won’t be that easy.
There’s been some big deterioration recently in the former tech leaders like Tesla (TSLA) , Netflix (NFLX) , and Facebook (FB). All of those are down 19+% from their recent highs.
When former market leaders like these go into their own personal bear market, it raises the antennas. That type of deterioration in those former leaders could be signaling that a stock market correction is in the cards for the overall markets.
So I thought I’d outline some common characteristics of recent stock market corrections from 2011 and 2012. Let’s take a look at some charts below.
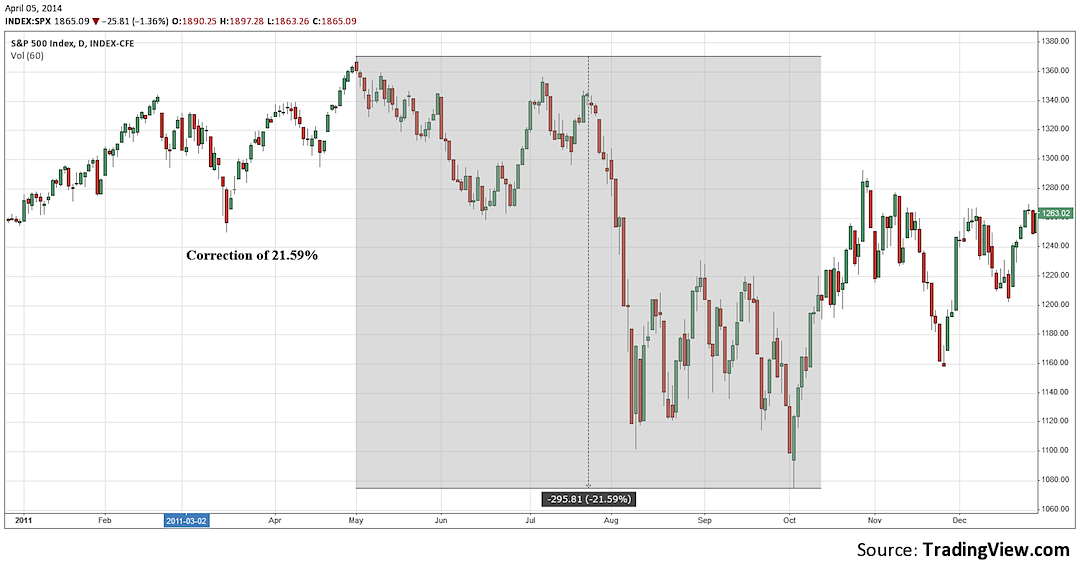
The first chart is a daily chart of the S&P 500 (SPX) from 2011. It simply shows highlights that the stock market correction from top to bottom was -21.59%.
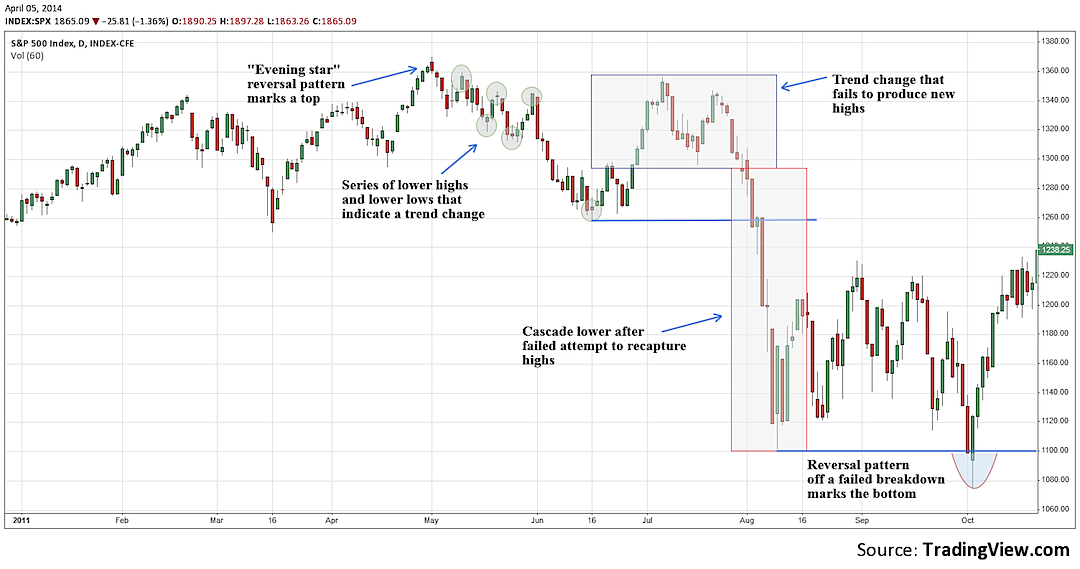
The second chart of the S&P 500 from 2011, shows a few interesting characteristics that are typical in market corrections. The first thing you’ll notice is the “buyers exhaustion” takes place when an evening star reversal pattern is formed. That alone shouldn’t alarm you much, but what should is the trend change that takes place after that exhaustion signal. As illustrated in the chart, you see that a series of lower highs and lower lows starts to take shape. That indicates that the short term trend has changed. After that you’ll notice that the S&P 500 tried to bottom and change trend again, but that failed. That failure led to a cascade lower. The bottom was marked by a failed breakdown and a “morning star” reversal pattern.
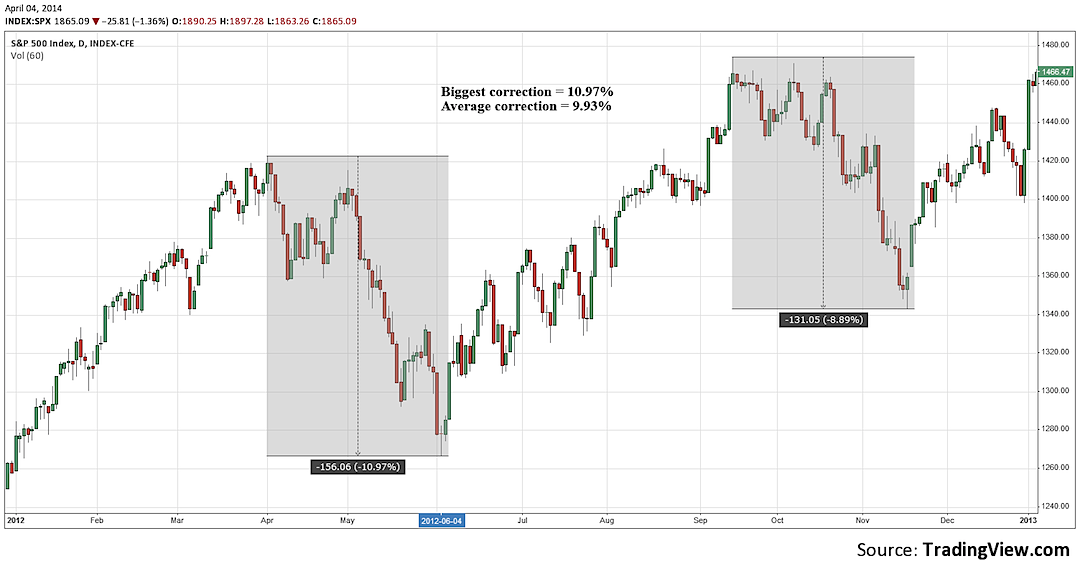
The third chart is a daily chart of the S&P 500 from 2012. It shows that 2 meaningful stock market corrections took place in that year. The April-June correction was 10.93% and the September-November one was 8.89%. This averages out to 9.91%.
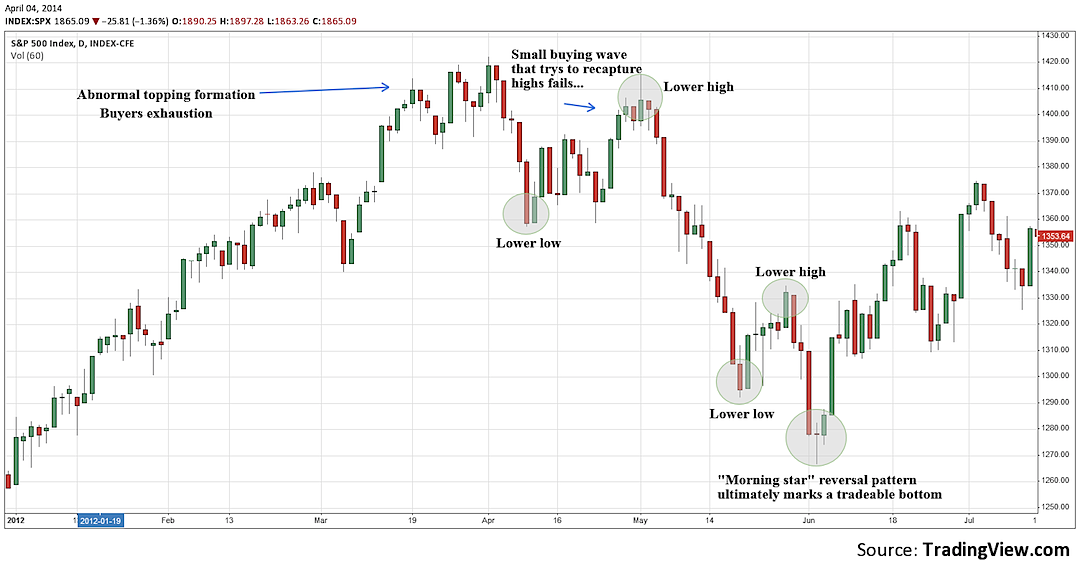
The fourth chart shows the characteristics of the 10.93% correction in 2012. The market tops out after 2 separate attempts at new highs fail to get any follow through buying interest. Next you’ll see a lower low is formed, followed by a failed attempt to recapture new highs (lower high). Then you see the trend change that takes place with lower highs and lower lows. The bottom is marked by a “morning star” reversal pattern.
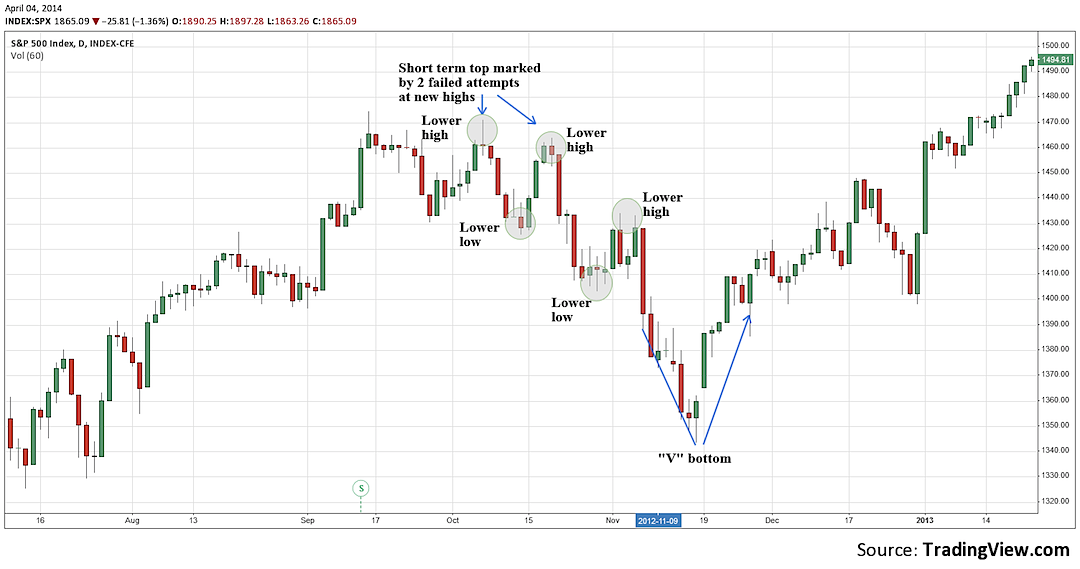
The last chart shows the structure of the S&P 500 (SPX) 8.89% stock market correction in 2012. The market tops out after 2 separate failed attempts at new highs takes place. Next, a series of lower highs and lower lows indicates that the short-term trend has changed. The end of the correction is marked by a “V bottom.”
As you can see there are some common characteristics in stock market corrections. The 1st thing to watch out for is the “buyers exhaustion.” From the charts above, those showed up as a failed break out attempt or by the “evening star” reversal pattern. The next thing to look for is a series of lower highs and lower lows that indicates a short-term trend change. From the charts above, “morning star” reversal patterns have marked bottoms. Also, technical indicators like the RSI have proven to be nice guides for overbought and oversold signals in the past.
I’m open to the possibility that the recent weakness we’ve seen in the former market leaders will be short lived, and we could resume the march to new highs again. In my opinion, if these former tech leaders like Facebook (FB) , Netflix (NFLX), and Tesla (TSLA) are unable to regain traction, then it may be hard for the market to make new highs again in the short term.
I hope this post helps, and thank you for reading.
Twitter: @TraderRL23
No position in any of the securities mentioned at the time of publication. Any opinions expressed herein are solely those of the author, and do not in any way represent the views or opinions of any other person or entity.


