Market prices absorb all the information that’s out there. Perhaps that’s why several commodity prices surged in the months leading up to the Russian invasion of Ukraine.
And since then, they have come back down to earth.
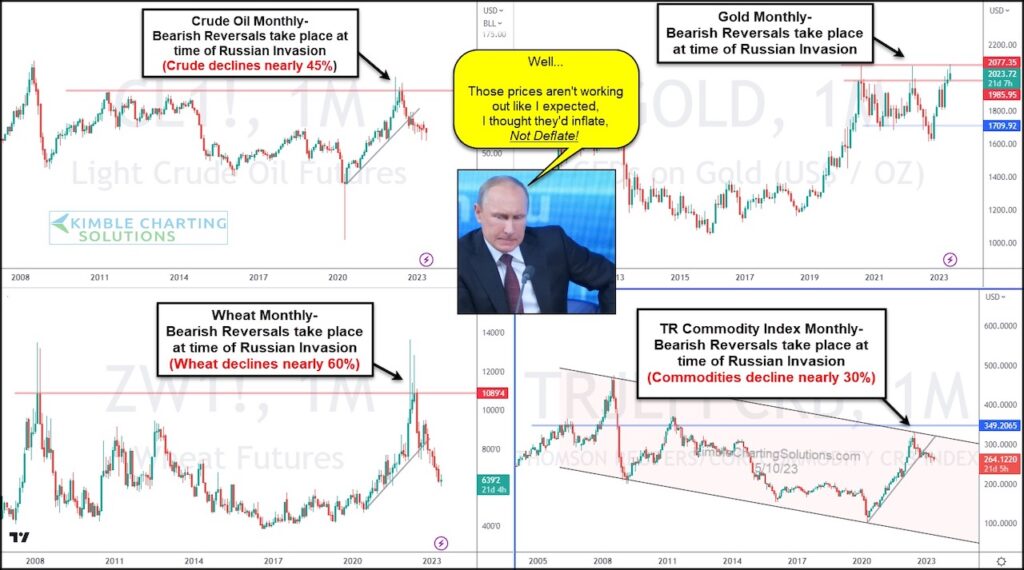
I don’t think this is exactly how Putin imagined the commodity markets working; both crude oil and wheat have fallen significantly from the highs. I’m not surprised… because the price patterns told us to be cautious.
Below we share a commodity 4-pack, looking at charts of Crude Oil, Gold, Wheat, and the Thomson Reuters Commodity Index on a “monthly” basis.
As you can see, 14-months ago these assets created monster bearish reversals, topping at the time of the Russian invasion. Since then, 3 of the 4 are greatly lower. Only gold is trading “near” those levels.
Clearly, it didn’t matter what Putin wanted, nor what pundits thought might happen. It’s all in the power of the pattern. And these bearish reversal patterns suggested these declines would take place.
Crude Oil “monthly” Chart
Note that KimbleCharting is offering a 2 week Free trial to See It Market readers. Just send me an email to services@kimblechartingsolutions.com for details to get set up.
Twitter: @KimbleCharting
Any opinions expressed herein are solely those of the author, and do not in any way represent the views or opinions of any other person or entity.

 Flirting With Critical Support… Again")


