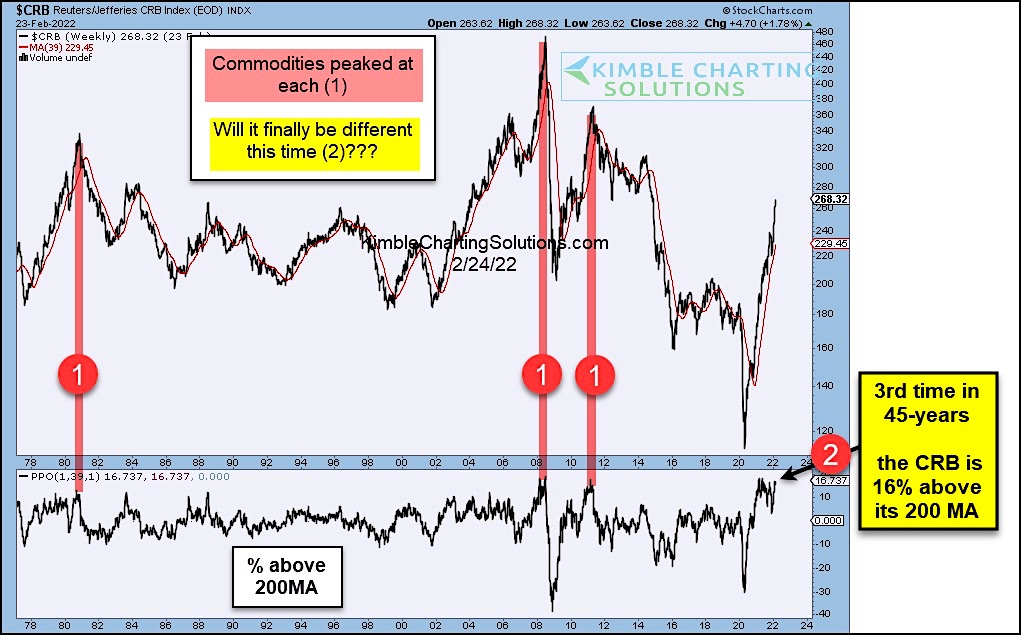
The CRB Commodity Index has rallied sharply over the past 2 years.
And although the index is not near all-time highs, it is getting stretched into overbought extremes.
One way to look at whether a security is trading near extreme levels is to check on its % above the 200-day moving average. This indicator is screaming overbought right now.
Only a few times has the CRB Commodity Index been this much above its 200-day moving average line – it is currently trading 16% above its 200-day.
Due to the Russian situation, it may seem odd for commodities to take a breather here. But perhaps a little “sell the news” or some consolidation will be in store. Either way, it’s worth watching. Stay tuned!
CRB Commodity Index Chart
Note that KimbleCharting is offering a 2 week Free trial to See It Market readers. Just send me an email to services@kimblechartingsolutions.com for details to get set up.
Twitter: @KimbleCharting
Any opinions expressed herein are solely those of the author, and do not in any way represent the views or opinions of any other person or entity.
")


")
