During the COVID pandemic, commodity prices soared. And this lead to a bout of inflation that we hadn’t seen in years.
But commodity prices have leveled off and this has helped to keep inflation in check.
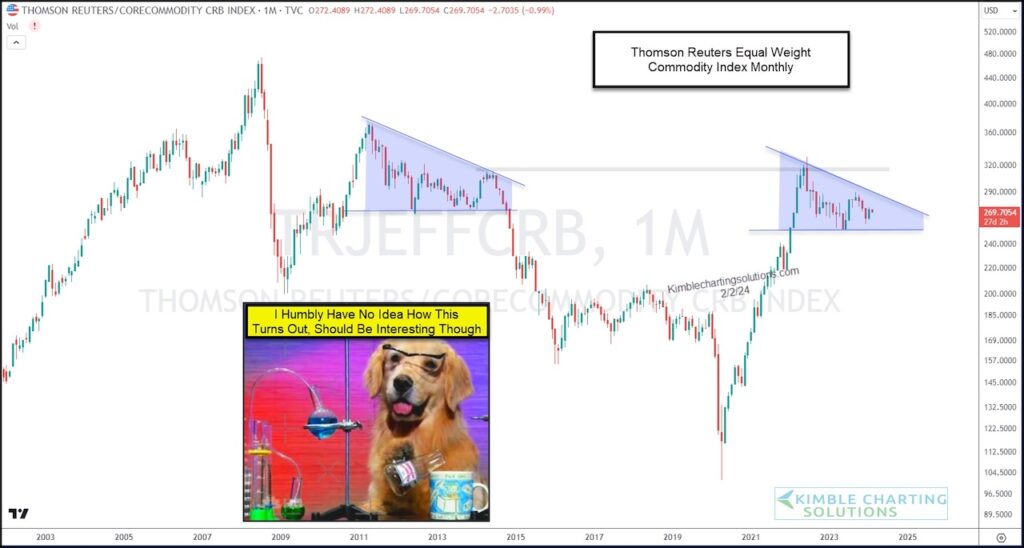
This consolidation like pattern can be see on today’s “monthly” chart of the Thomson Reuters Equal Weight Commodity Index (CRB).
The last time we saw a gigantic wedge pattern, it broke to the downside. But I humbly have no idea which way this pattern will break.
But I do think that when it does make a decisive move out of this pattern, it will be a big deal. So it’s worth keeping on your radar. Stay tuned!
$CRB Thomson Reuters Equal Weight Commodity Index “monthly” Chart
Note that KimbleCharting is offering a 2 week Free trial to See It Market readers. Just send me an email to services@kimblechartingsolutions.com for details to get set up.
Twitter: @KimbleCharting
Any opinions expressed herein are solely those of the author, and do not in any way represent the views or opinions of any other person or entity.

: Worrisome to Broader Market?")
