The rise in commodities prices has investors (and consumers) concerned about inflation again, with bond prices falling and bond yields rising. It also has investors on watch for breakouts and trading opportunities in select commodities.
Today, we take a look at an important broad index for this asset class: The Thomson Reuters Core Commodity Index. It’s nearing an important long-term juncture, so it’s a “quarterly” price chart.
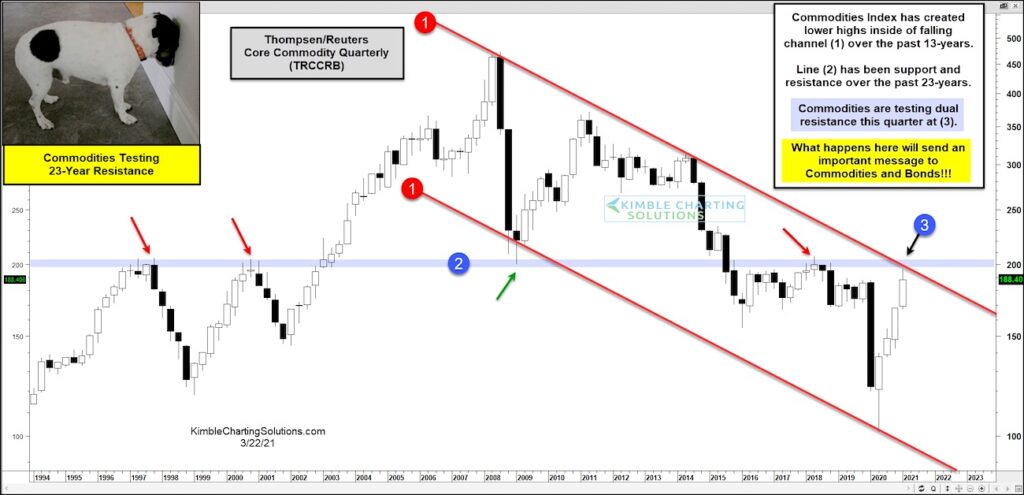
As you can see, commodities have been trading within a falling channel (marked by each 1) over the past 13 years. BUT last year’s reversal has spurred 4 straight quarters of gains and this commodity index is testing a key confluence of price resistance.
Line (2) has served as price support and resistance over the past 23-years! Price is testing this resistance at the same time that it is testing the top of the falling channel line at (3).
Whether it be Energy, Grains, or Precious Metals… it sure seems like commodities are nearing a very important juncture in time and price! What happens here will send an important message to commodities and bonds. Stay tuned!
Thomson Reuters Core Commodity Index “Quarterly” Chart
Note that KimbleCharting is offering a 2 week Free trial to See It Market readers. Just send me an email to services@kimblechartingsolutions.com for details to get set up.
Twitter: @KimbleCharting
Any opinions expressed herein are solely those of the author, and do not in any way represent the views or opinions of any other person or entity.


