The following is a recap of the May 27 Commitment Of Traders Report (COT) released by the CFTC (Commodity Futures Trading Commission) looking at COT data and futures positions of non-commercial holdings as of May 24. Note that the change in COT report data is week-over-week. This blog post originally appeared on Hedgopia.com – Paban’s blog.
Trading Insights and Analysis from the Commitment Of Traders Report
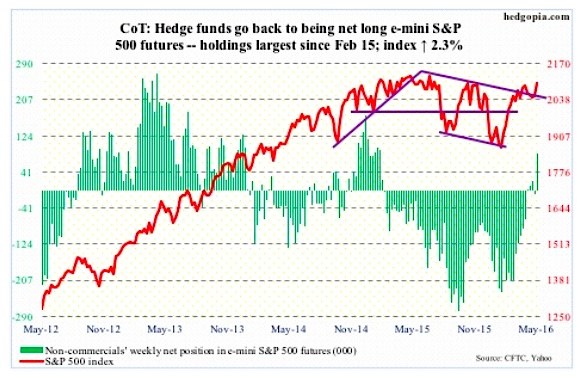
E-mini S&P 500: With one session to go, the old adage ‘sell in May and go away’ has not quite panned out. The S&P 500 is up 1.6 percent for the month… was down as much as 1.9 percent through the May 19th intra-day low. But bulls stepped up, defending crucial support at 2040. This is the positive side to the story for stocks.
On the negative side, we saw a continued failure of the current rally to excite retail investors. Another $4.8 billion came out of U.S.-based equity funds in the week ended Wednesday (courtesy of Lipper). Just this month, $26 billion has come out, and north of $42 billion since the February 10th week.
Along the same lines, $2.4 billion left SPY, the SPDR S&P 500 ETF, in the week ended Wednesday (courtesy of ETF.com). Tuesday saw the ETF surge 1.3 percent, but the session only attracted $51.4 million, but Wednesday did attract $647 million.
With the 2.3-percent rally this week, the S&P 500 once again finds itself right on the May 2015 trend line. On April 20th, a breakout attempt was vehemently rejected, resulting in the subsequent sell-off. Plenty of buying power has been expended in bringing the index up against this resistance, with daily technicals now overbought.
Commitment of Traders Report: Currently net long 83.4k, up 92.3k.
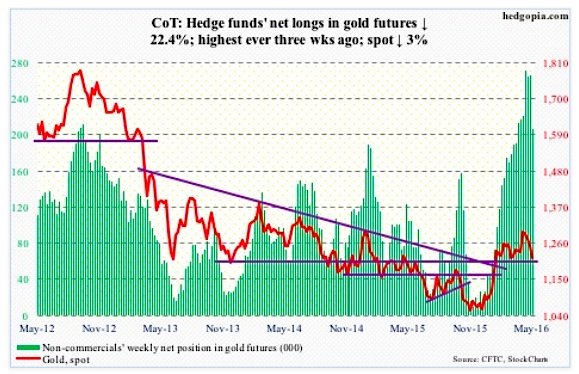
Gold: Spot gold prices saw a weekly bearish MACD crossover last week. Gold dropped three percent for the week, with weekly momentum indicators already under pressure and approaching/at the median. In nearly four months now, there probably has not been a better opportunity for gold bugs to step up to the plate.
Spot gold prices are at the lower bound of a nearly four-month range, at the lower Bollinger Band and is grossly oversold on a daily chart.
Inflows into GLD, the SPDR gold ETF, have not stopped. In the week ended Wednesday, it attracted $516 million (courtesy of ETF.com).
However, the wild card continues to be non-commercials. Three weeks ago, net longs of gold were the highest ever, even as gold has only been marking time the past four months. The risk is if and when these traders lose patience. This week, they reduced holdings by 22 percent. Gold bugs surely hope this is not a trend.
Commitment of Traders Report: Currently net long 206.6k, down 59.7k.
Crude oil: OPEC meets on June 2nd (Thursday). Crude oil prices rallied strongly into the meeting. The likes of Angola, Nigeria, and Venezuela have suffered a lot from the drop in oil. But they don’t carry much weight within the cartel.
It is probably unrealistic to expect Saudi Arabia to deviate from its market-share goals. As is to expect Iran to agree to a production cutback. In fact, the latter on Sunday did say it had no plan to halt a rise in production and exports. Its crude oil exports, excluding gas condensates, are two million barrels per day currently and would reach 2.2 mb/d by the end of summer.
Markets currently are focused on the positives.
For the week ended May 20th, U.S. crude stockpile dropped by 4.2 million barrels to 537.1 million barrels. Inventory is now down 6.3 million barrels from the April 29th high of 543.4 million barrels, which was the highest since the all-time high 545.2 million barrels in October 1929.
Crude oil imports fell, too, down 362,000 barrels per day to 7.3 million b/d.
Crude oil production fell by another 24,000 b/d, to 8.77 mb/d. This was the 11th straight weekly drop and seventh sub-nine mb/d. Production peaked at 9.61 mb/d in the June 5th week last year.
Also declining was distillate inventory, down 1.3 million barrels to 150.9 million barrels. This was a sixth straight weekly drop.
Gasoline stocks, however, were up two million barrels to 240.1 million barrels. Also, refinery utilization decreased eight-tenths of a percent to 89.7 percent.
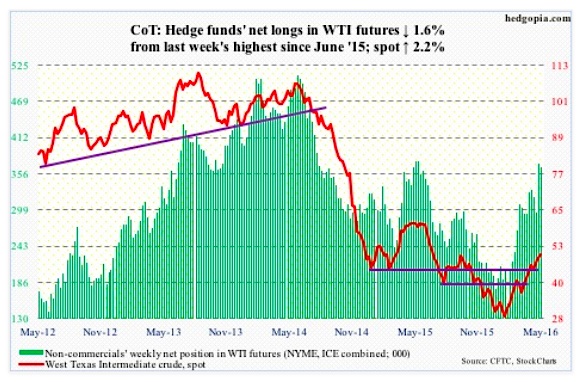
For the week, spot West Texas Intermediate crude oil was up another 2.2 percent – its seventh positive week in the past eight. Extended, yes, but momentum is intact, with the crude rallying along its upward-sloping 10-day moving average. It needs to drop north of five percent to go test its 20-day moving average.
Commitment of Traders Report: Currently net long 365.1k, down 6k.
Thanks for reading.
Twitter: @hedgopia
Read more from Paban on his blog.
The author may hold positions in mentioned securities at the time of publication. Any opinions expressed herein are solely those of the author, and do not in any way represent the views or opinions of any other person or entity.


 Trading Into Inflection Point")