Year to date, the Nasdaq Composite is the best performing major index in the US equity indices, up 6.51% YTD. However, both the Dow Jones Industrials and Transports are negative YTD, down 2.36% and 9.45% respectively. In addition, the S&P 500 and Russell 2000 are up fractionally, 1.32% for the S&P and 0.36% for the Russell.
So let’s look at some charts to provide a technical update on the major US equity indices. We’ll look at where we are at and discuss some levels to watch to determine where we are headed.
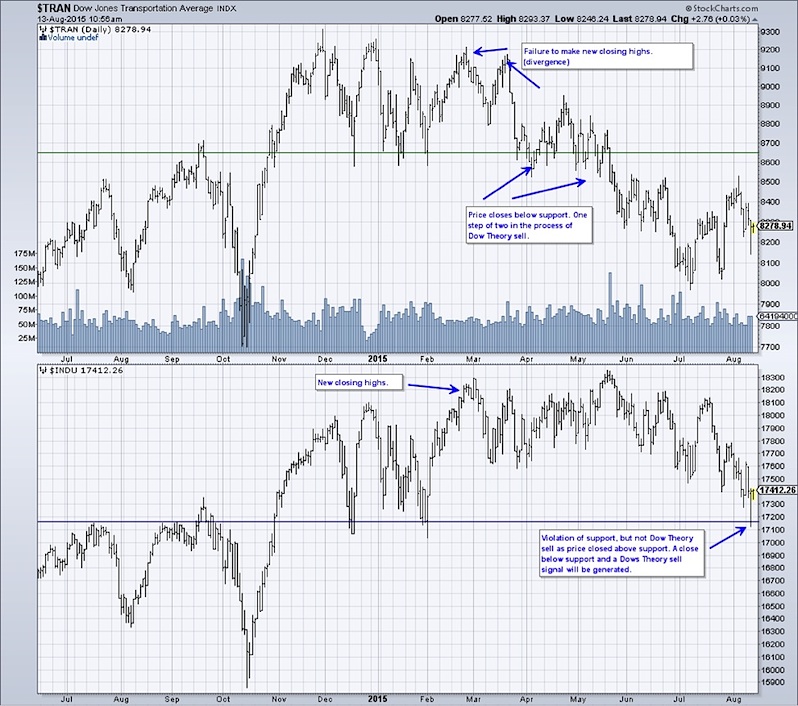
The first chart below shows that we are very close to a Dow Theory sell signal. Should we see the Dow Industrials close below 17164.95 that would confirm the sell signal. Until that point, all we have is a divergence in performance and closing highs in both the Transports and Industrials.
Dow Jones Industrials vs Transports – Dow Theory Signal Nearing?
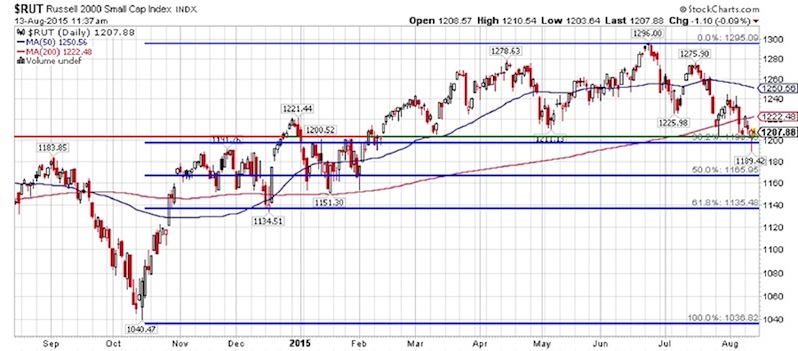
Looking at the Russell 2000 we see that the 1200 area is a pretty important support level. We’re sitting at a 38.2% retracement level of the move from the October lows to the high of 1296 in June. In addition, the index is just below the 200 day moving average of 1222, which is a good gauge of the longer term trend. If the Russell 2000 doesn’t hold support and bounce here, the area that I would look to next for support would be 1135-1150. In turn, it would be positive to see the Russell trade above 1225-1245.
Russell 2000 Chart
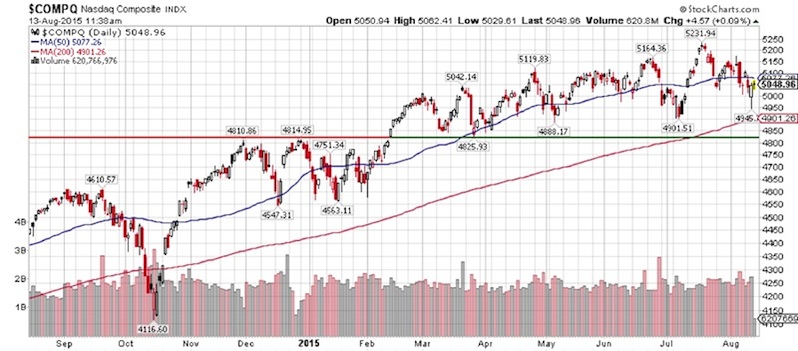
Looking at the Nasdaq, the price action looks relatively constructive although its trading slightly below the 50 day moving average of 5077. It would be bullish to see price climb back above that level. The primary level of support to watch now is 4800, which is not too much lower than the 200 day moving average of 4901.
Nasdaq Composite Chart
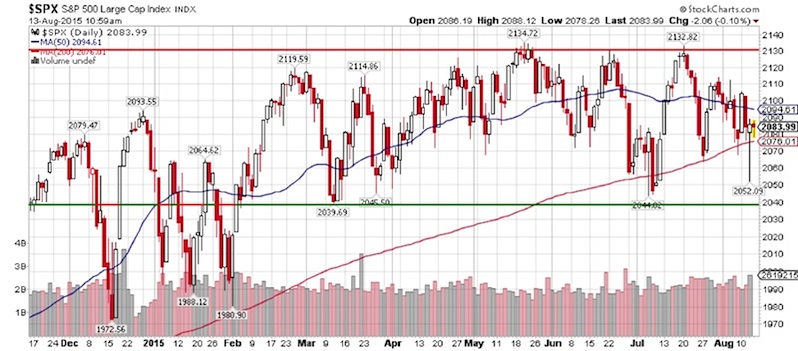
The last of the major US equity indices that we’ll look at is the S&P 500. Here we have a trading range of 2040-2130. Until we have a breakout in either direction, we don’t see real confirmation of which way the S&P will trade. At present we’re sitting just below the 50 day moving average of 2094 and just above the 200 day moving average of 2076. Looking at the moving averages, we see the longer term 200DMA sloping up which is a positive, however the shorter term 50DMA is rolling over (a reason to be cautious). A sustained move above 2135 would be reason to look for the S&P to continue higher with another stage of its Bull run. However, a breakdown in price below 2040, and we very well could see price trade down another 60-70 points to the 1970-1980 level.
S&P 500 Chart
Thanks for reading and have a great weekend.
Twitter: @Snyder_Karl
Any opinions expressed herein are solely those of the author, and do not in any way represent the views or opinions of any other person or entity.

: Showing Some Signs of Emerging Strength")
