The most covered market development of 2014 may be that there’s hardly a market to cover, at all. As Ryan Detrick pointed out yesterday on the S&P 500 and JLFMI showed today on the NASDAQ 100, volatility has devolved so completely into meaningless slosh that broad volatility measures such as the VIX – while near it’s historic lows – may not be doing the flatlined speculative somnolence justice.
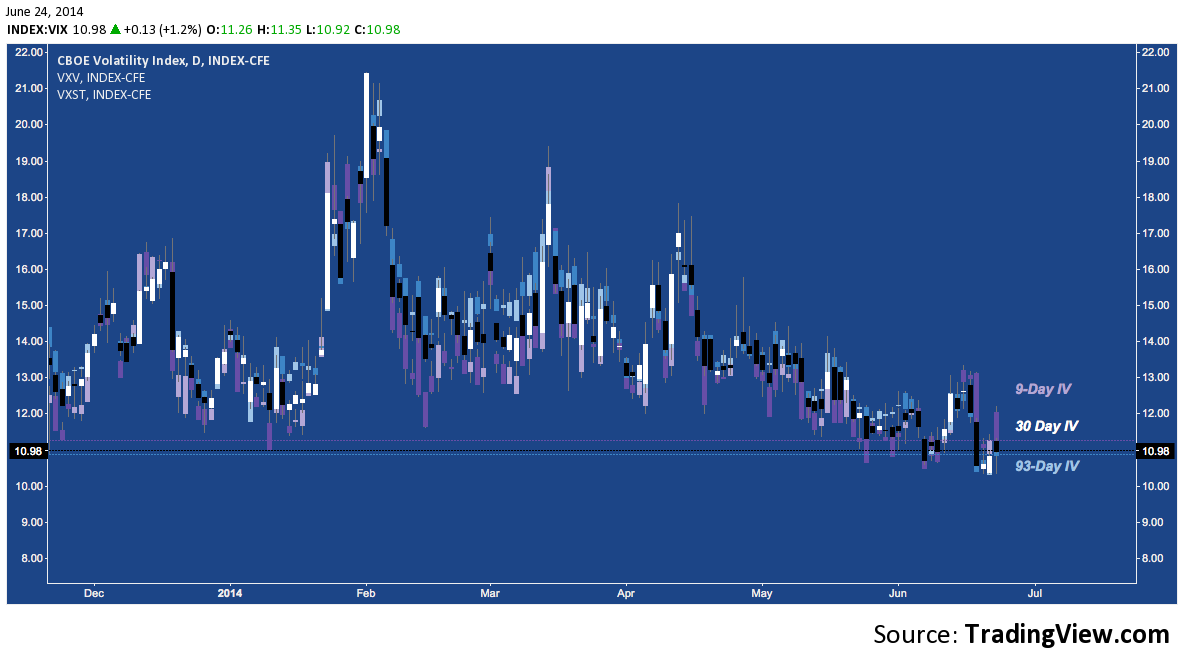
Implied volatility has picked up this week (ever so slightly) as protection is bid (why not? hedging – for those prudent enough to still do it – is dirt cheap); but on an immediate (VXST), short (VIX) and short-medium (VXV)-term basis remains at multi-year or all-time lows:
Though the underlying index is narrower in scope, perhaps VXO (the S&P 100’s VIX) tells the tale better as it matches 1993’s all-time lows:
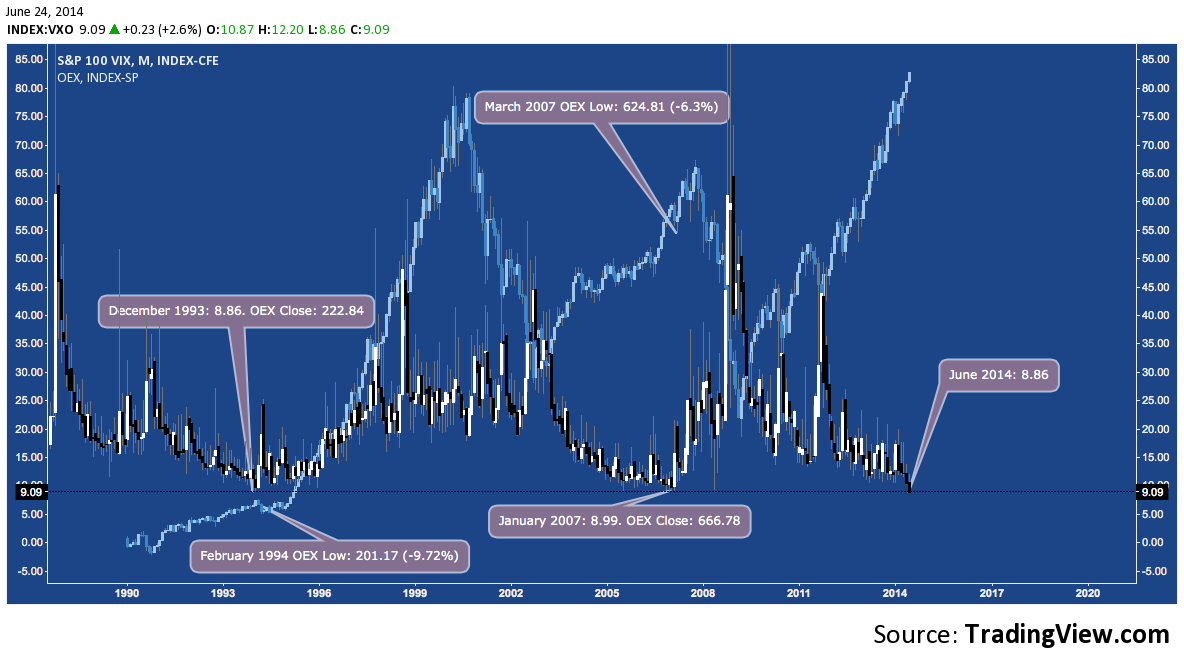
Interestingly, the last two times VXO touched near this all-time monthly low, it did spark a brief (~2 months in duration) but significant pullback (-9.72% and -6.3%).
Predicated on the worldwide trend of Central Bank market activism and largesse as it is, the current environment of crushed volatility really is a global intermarket phenomenon. And just like mid-90s and mid-2000s, there’s a seemingly interminable persistence to this “low volatility regime” that has many market observers closely parsing for even the vaguest clues about when (if?) higher volatility will make a reappearance.
A glance across a selection of key asset classes shows 1) historically low volatility is pervasive across different markets, and 2) there are well-defined consolidation/congestion patterns engendered by the narrow ranges that have resulted that are all nearing completion. When these ranges do resolve, they are likely kick off a feedback loop that will reanimate cross-asset class correlations (and inverse correlations) and result in major range expansion across the board.
The S&P 500 (SPX) is riding the top of a 5.25 year Rising Wedge pattern. Measuring volatility by the distance between Bollinger Bands (see the Bollinger Bandwidth (BBW) in the lower panel) on the weekly chart, in spite of last year’s (and increasingly, this year’s) outlying performance SPX volatility is at a trough that has sparked both short and long-term volatility in recent years:
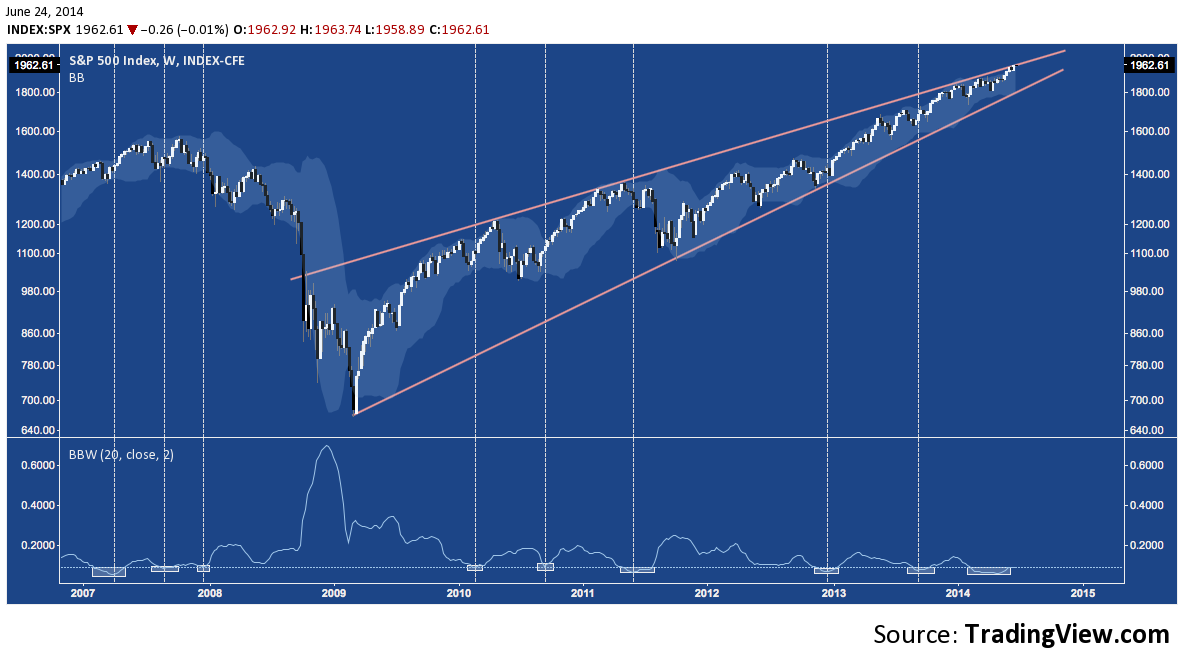
As quiet as it may seem, the S&P 500 is something of an elevated volatility outlier, as well. By this measure (BBW), the other instruments we’ll review below are even more subdued; and all of them are winding through patterns that will culminate in major breakouts and range expansion.
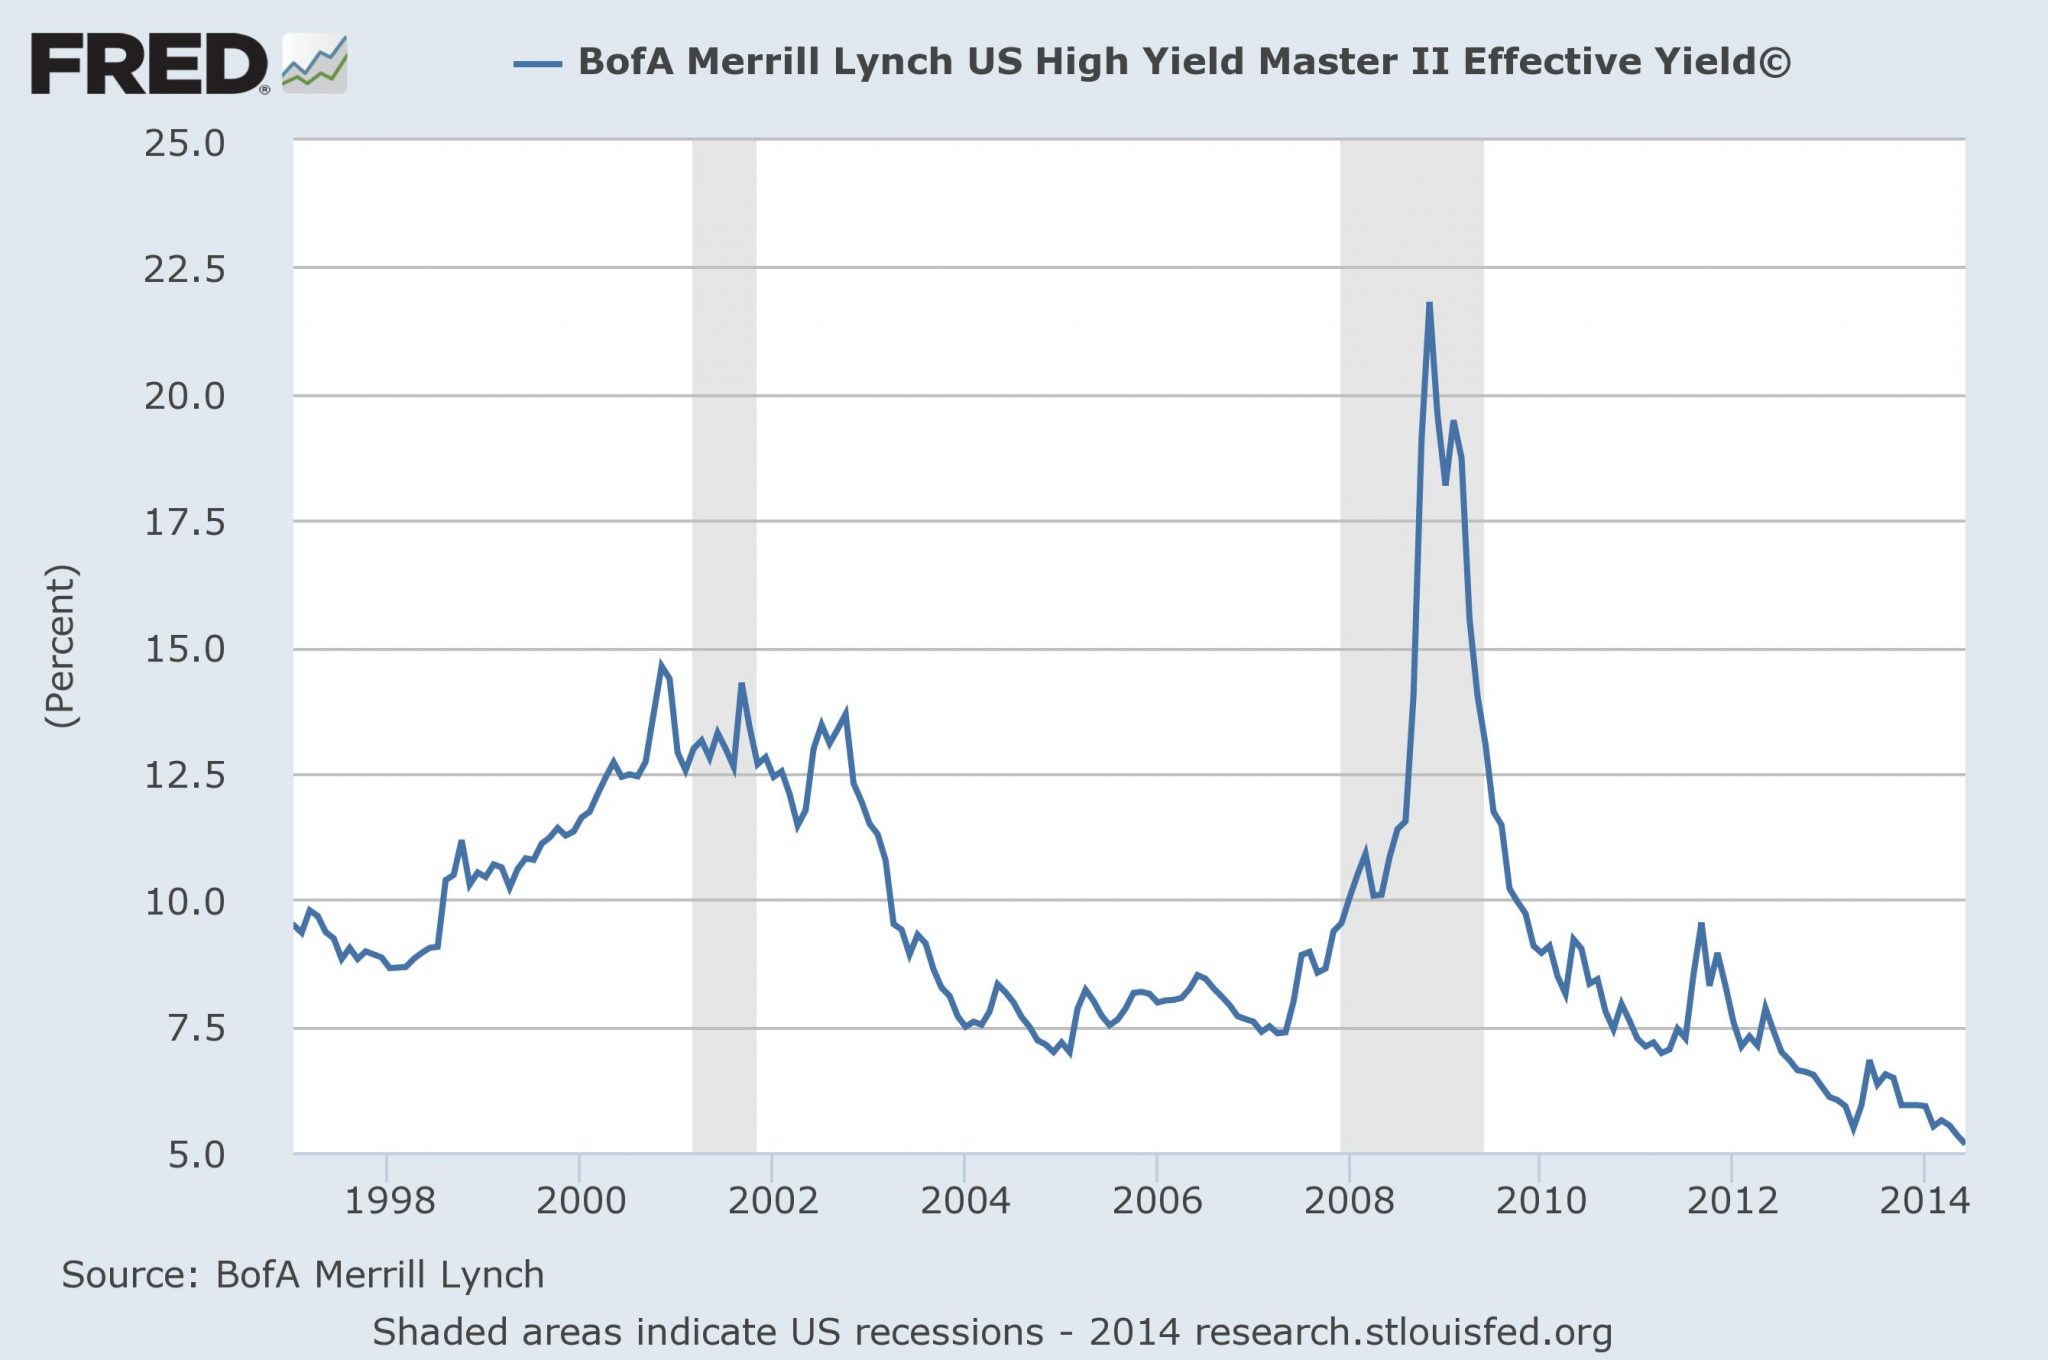
Take the rising wedge (and wedge-within-a-wedge) on the Ishares High Yield Corporate Bond ETF (HYG) monthly chart. In it’s – albeit brief – history Bollinger Band Bandwidth has never been this low.
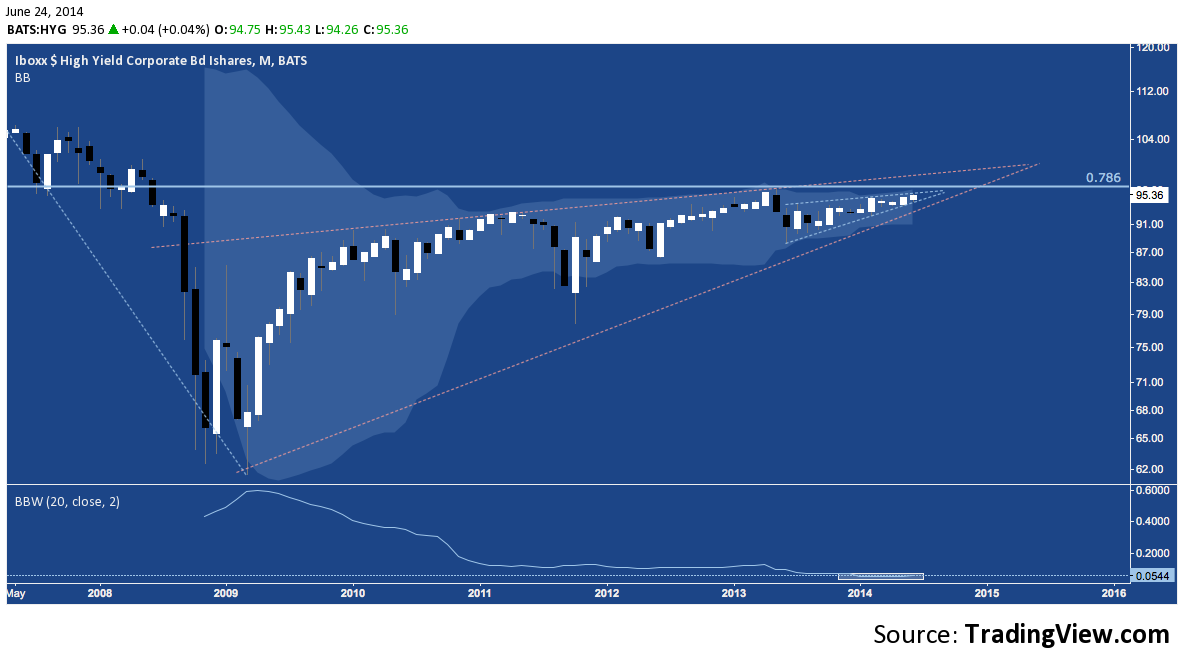
If HYG had been around longer, though, it’s likely this would equate to multi-decade or all-time range lows here along with the asset class’s farcically cratered yields:
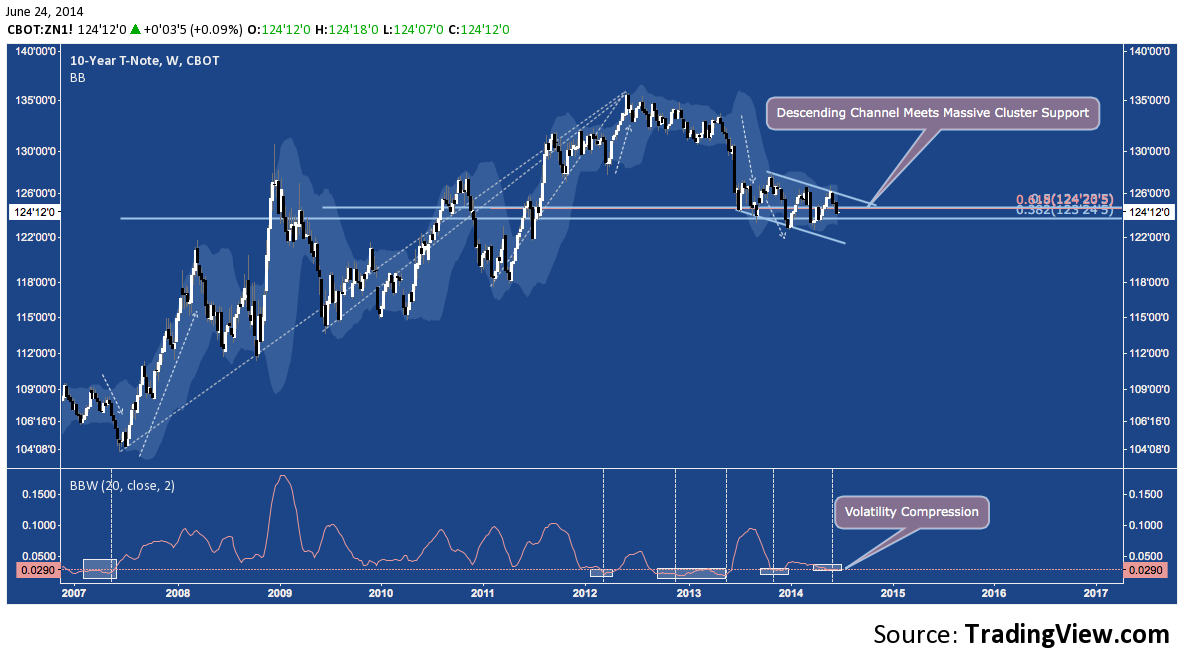
At the other end of the quality spectrum, the 10-Year US Treasury Note (ZN) is in a similar spot. In fact, since the beginning of 2013 – and despite last year’s Taper hiccup – the T-Note is going through it’s quietest period in decades. Note the incidence of how often volatility is compressed to its current level; and the ranges that typically result:
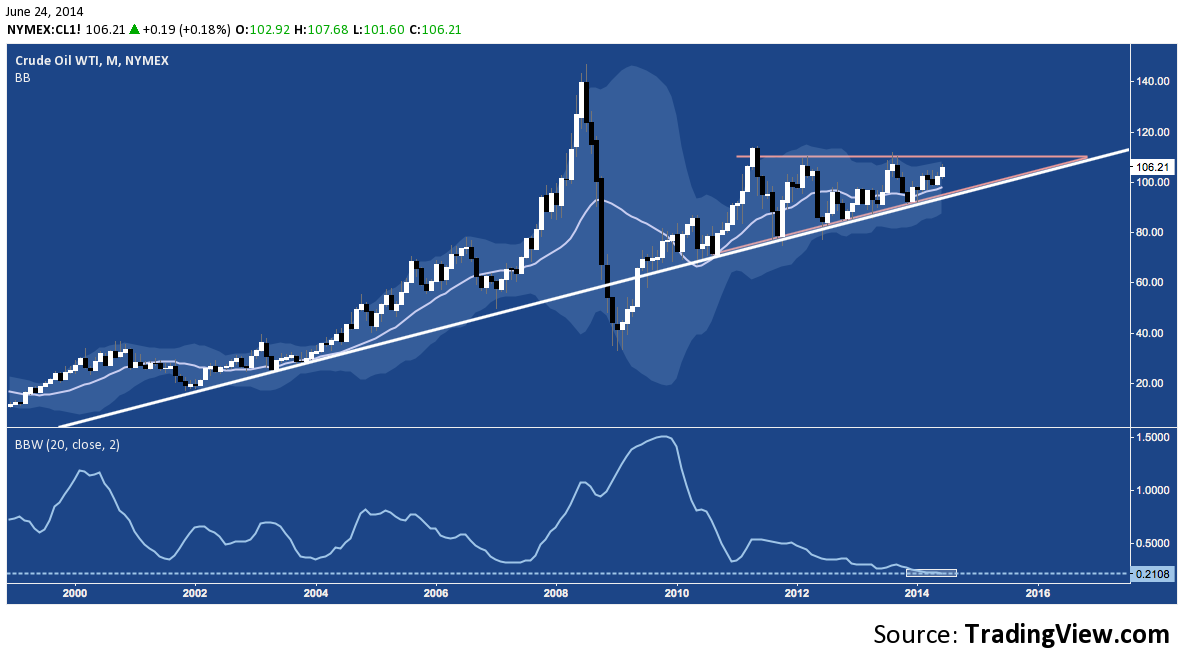
How about WTI Crude Oil’s (CL) monthly chart? After the 2008 drop and 2009-2010 recovery, Crude has been oscillating through an Ascending Triangle. Though 2006 came close (check the massive 2006-2008 meltup), volatility rarely ever been this low:
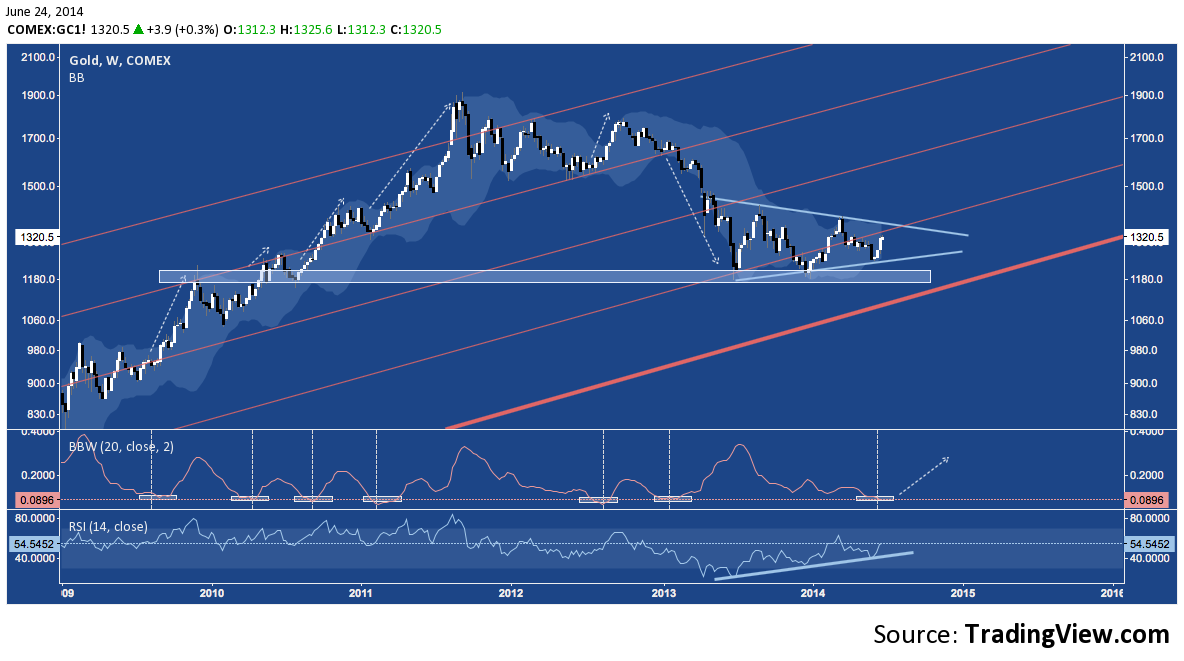
Gold (GC) much-tarnished following early 2013’s drop has been consolidating in a Symmetrical Triangle just above key support reaching back to 2009-2010. This tightly-wound consolidation pattern has resulted in a market tied for lowest volatility with several other occurrences in the last 5 years, all of which produced significant range expansions:
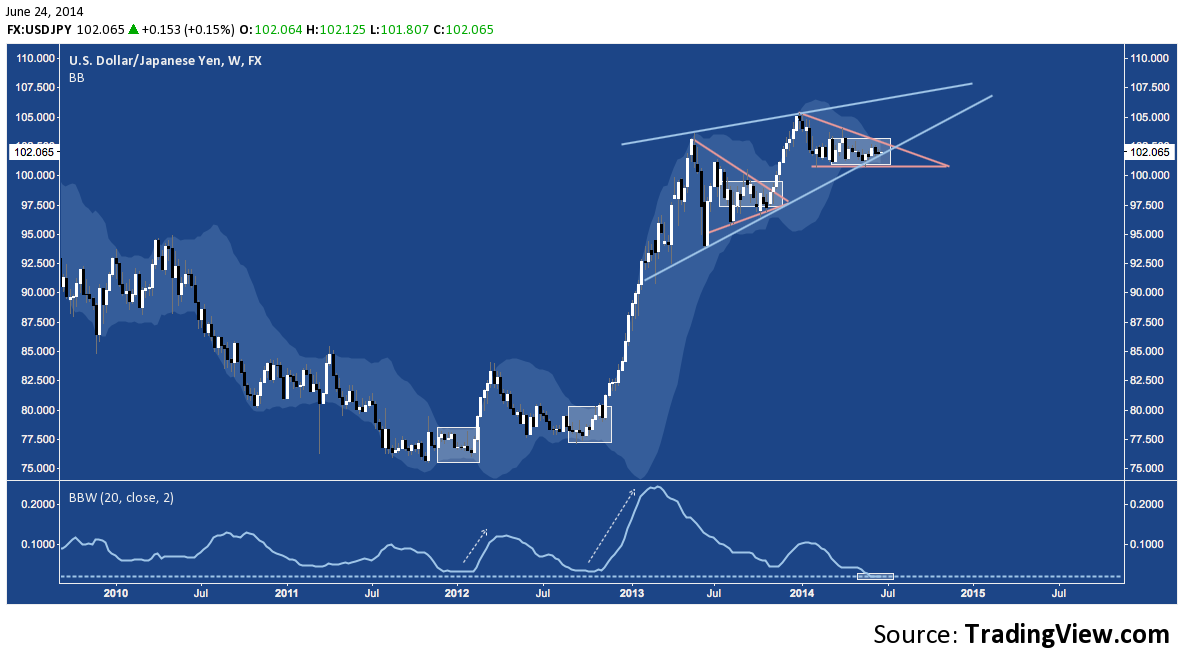
Turning to the Forex, USD/JPY is in passing through it’s most persistent low volatility state ever. Riveted to 102 for 6 months, the pair has moved into the optimum breakout window of a Descending Triangle that continues to press larger Rising Wedge support. Not pictured below: the descending secular trend line that runs through 103-104.
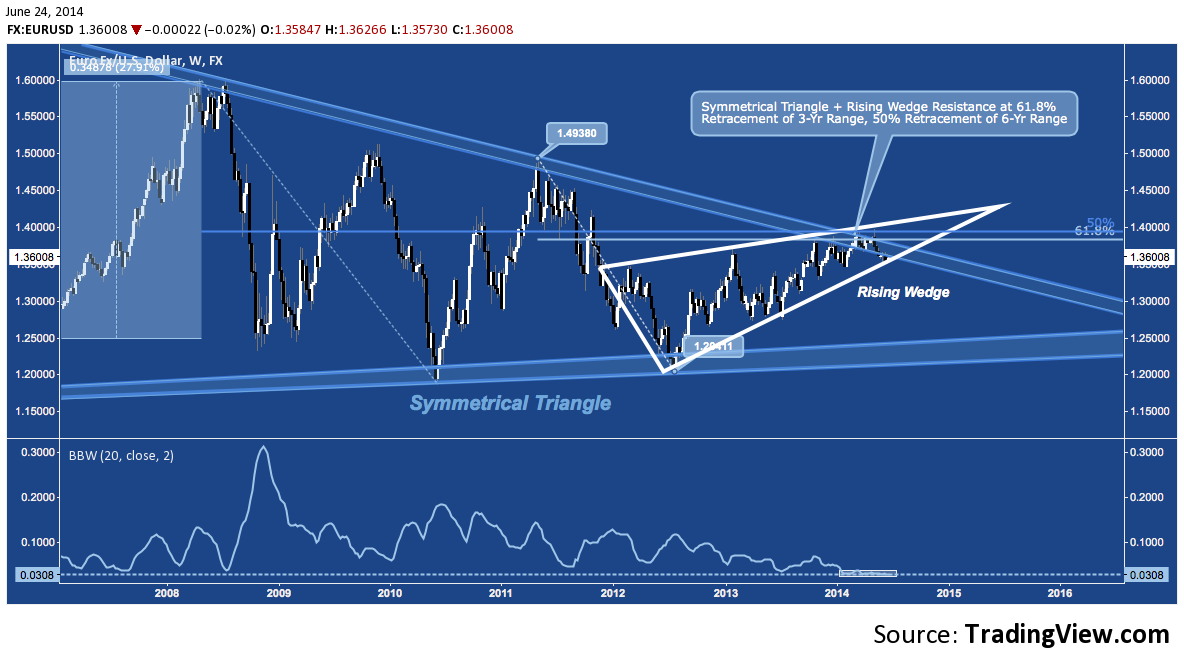
EUR/USD is also pushing into the latter reaches of its own (much larger) rising wedge at an ebb of volatility seen only once before (October 2006) since the inception of the Euro. That time around, a couple weeks later the pair embarked a historic 28% run higher.
Twitter: @andrewunknown and @seeitmarket
Author holds no exposure to securities mentioned at the time of publication. Commentary provided is for educational purposes only and in no way constitutes trading or investment advice. Zombie silhouette image courtesy pintrest.com/Joanna Krajewski


